PTM Analysis - Sequence Logo
DPA Analysis
FGCZ
29 July, 2026
Source:vignettes/Analysis_seqlogo.Rmd
Analysis_seqlogo.RmdIntroduction
This document performs sequence logo analysis on significantly regulated sites from DPA analysis. Sequence motifs help identify active kinases driving PTM changes.
desc <- switch(params$sheet,
  "DPA" = "**DPA (Differential PTM Abundance)**: Raw PTM signal changes. Sequence motifs may reflect both abundance and stoichiometry effects.",
  "DPU" = "**DPU (Differential PTM Usage)**: Protein-normalized changes. Sequence motifs reflect genuine kinase activity changes.",
  "CF" = "**CF (CorrectFirst)**: Alternative normalization. Sequence motifs reflect activity changes with different correction approach."
)
cat(desc)
DPA (Differential PTM Abundance): Raw PTM signal changes. Sequence motifs may reflect both abundance and stoichiometry effects.
Data Loading
if (pipeline_mode) {
  message("Loading data from: ", params$xlsx_file, " (sheet: ", params$sheet, ")")
  data <- readxl::read_xlsx(params$xlsx_file, sheet = params$sheet)
} else {
  # Vignette mode: use example data
  data("combined_test_diff_example", package = "prophosqua")
  data <- combined_test_diff_example
  message("Using example data from prophosqua package")
}

data_info <- tibble(
  Property = c("Mode", "Sheet", "Rows", "Contrasts"),
  Value = c(
    if (pipeline_mode) basename(params$xlsx_file) else "Example data",
    params$sheet,
    nrow(data), paste(unique(data$contrast), collapse = ", ")
  )
)
knitr::kable(data_info, caption = "Data Summary")| Property | Value |
|---|---|
| Mode | Example data |
| Sheet | DPA |
| Rows | 105824 |
| Contrasts | KO_vs_WT, KO_vs_WT_at_Early, KO_vs_WT_at_Late, KO_vs_WT_at_Uninfect |
Filter Significant Sites
Filter sites with |log2FC| > 0.6 and FDR < 0.05.
# Use shared filtering function with sequence validation
significant_sites <- data |>
  dplyr::filter(!is.na(posInProtein)) |>
  filter_significant_sites(
    fdr_threshold = params$fdr,
    fc_threshold = params$fc,
    require_sequence = TRUE
  )

cat("Found", nrow(significant_sites), "significant sites\n")
## Found 7418 significant sitesCount Significant Sites
stopifnot("No significant sites found. Adjust fdr/log2fc thresholds in config." = nrow(significant_sites) > 0)

tx <- as.data.frame(with(significant_sites, table(contrast, regulation, modAA)))
capt <- paste0("Number of significantly regulated sites by contrast, residue, and regulation direction (", params$sheet, ").")

knitr::kable(tx, caption = capt)| contrast | regulation | modAA | Freq |
|---|---|---|---|
| KO_vs_WT | downregulated | S | 807 |
| KO_vs_WT_at_Early | downregulated | S | 788 |
| KO_vs_WT_at_Late | downregulated | S | 797 |
| KO_vs_WT_at_Uninfect | downregulated | S | 484 |
| KO_vs_WT | upregulated | S | 814 |
| KO_vs_WT_at_Early | upregulated | S | 812 |
| KO_vs_WT_at_Late | upregulated | S | 890 |
| KO_vs_WT_at_Uninfect | upregulated | S | 434 |
| KO_vs_WT | downregulated | T | 217 |
| KO_vs_WT_at_Early | downregulated | T | 177 |
| KO_vs_WT_at_Late | downregulated | T | 250 |
| KO_vs_WT_at_Uninfect | downregulated | T | 107 |
| KO_vs_WT | upregulated | T | 153 |
| KO_vs_WT_at_Early | upregulated | T | 170 |
| KO_vs_WT_at_Late | upregulated | T | 177 |
| KO_vs_WT_at_Uninfect | upregulated | T | 59 |
| KO_vs_WT | downregulated | Y | 12 |
| KO_vs_WT_at_Early | downregulated | Y | 17 |
| KO_vs_WT_at_Late | downregulated | Y | 13 |
| KO_vs_WT_at_Uninfect | downregulated | Y | 9 |
| KO_vs_WT | upregulated | Y | 56 |
| KO_vs_WT_at_Early | upregulated | Y | 78 |
| KO_vs_WT_at_Late | upregulated | Y | 76 |
| KO_vs_WT_at_Uninfect | upregulated | Y | 21 |
Validate Sequence Window
Ensure the central residue matches the modified amino acid.
# Use shared validation function
significant_sites <- validate_sequence_window(significant_sites)

cat("After validation:", nrow(significant_sites), "sites remain\n")
## After validation: 7269 sites remainSequence Logo Analysis
Generate Sequence Logos
seq_list <- significant_sites |>
  dplyr::mutate(.grp = paste(contrast, regulation, sep = "_")) |>
  dplyr::group_by(.grp) |>
  dplyr::summarize(
    seqs = list(toupper(SequenceWindow)),
    .groups = "drop"
  ) |>
  with(setNames(seqs, .grp))

if (length(seq_list) > 0) {
  ggseqlogo(
    seq_list,
    ncol = 2,
    seq_type = "aa",
    method = "probability"
  )
} else {
  cat("No significant sites found for sequence logo generation.\n")
}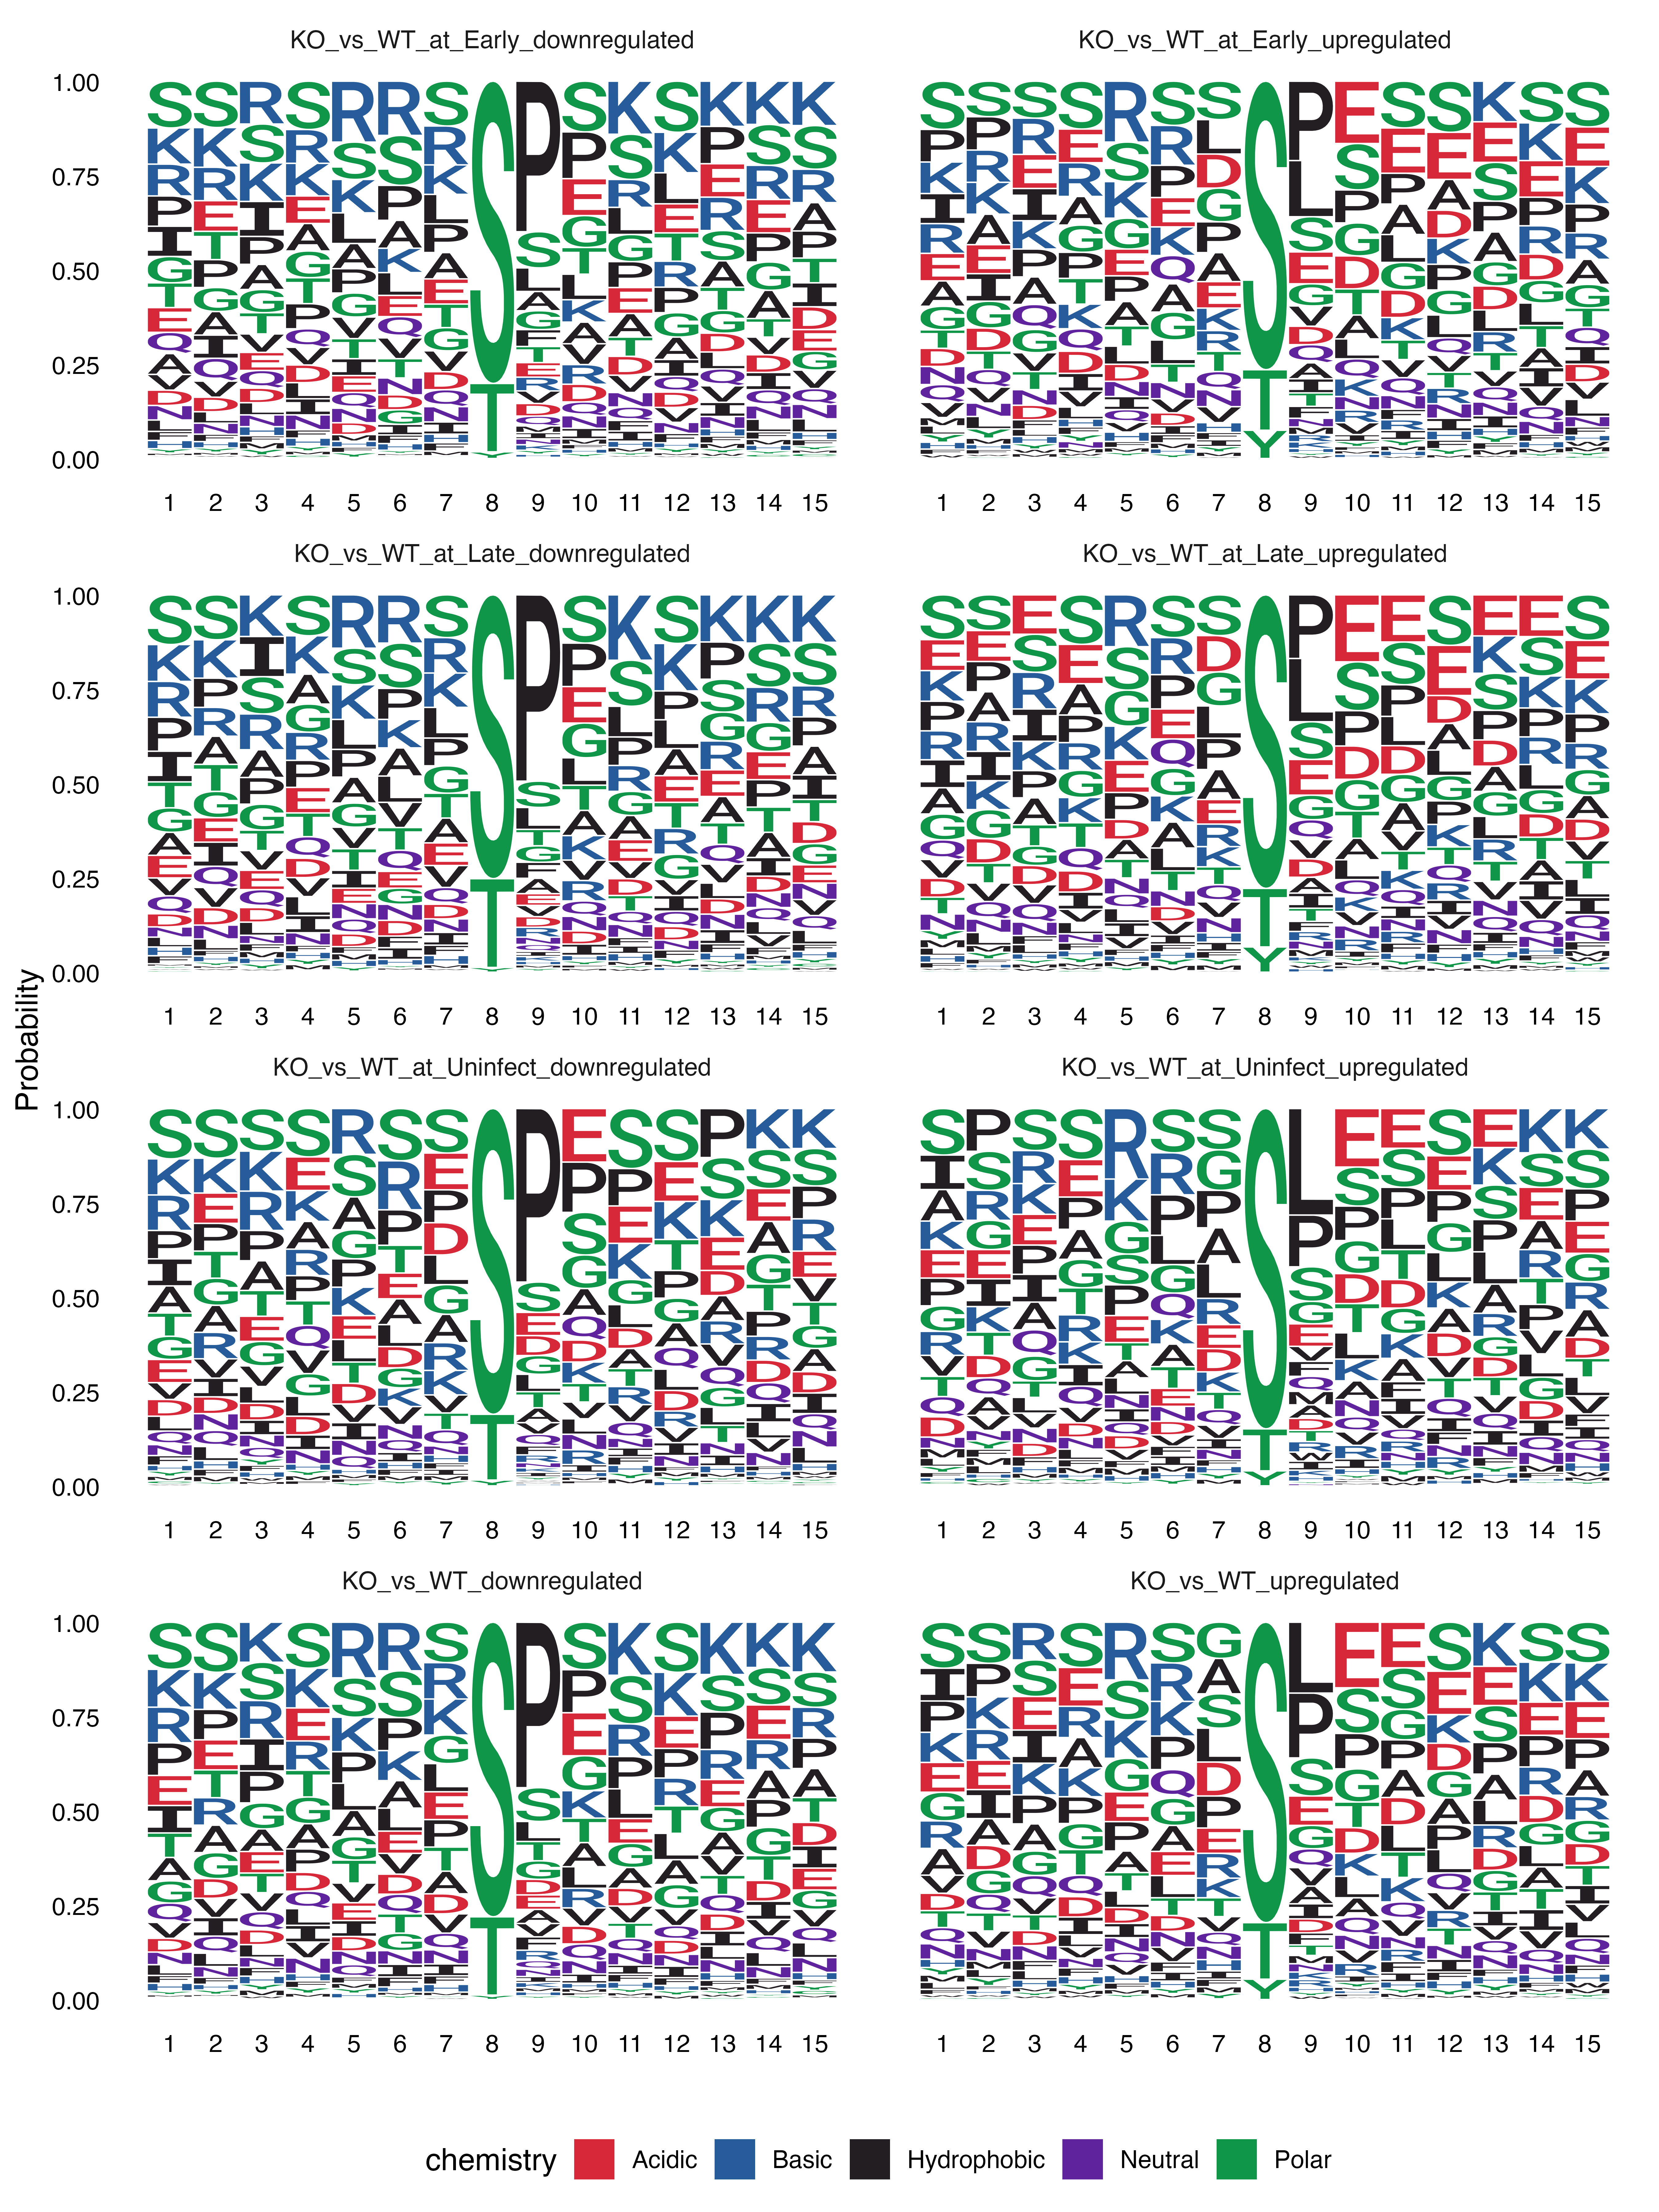
Sequence logos for significantly regulated sites by contrast and regulation direction.
Difference Logo Analysis
Visualize the difference in amino acid enrichment between upregulated and downregulated sites.
p_diff <- prophosqua::plot_diff_logo(significant_sites)

if (!is.null(p_diff)) {
  print(p_diff)
} else {
  cat("No contrasts with both upregulated and downregulated sites found for difference logo.\n")
}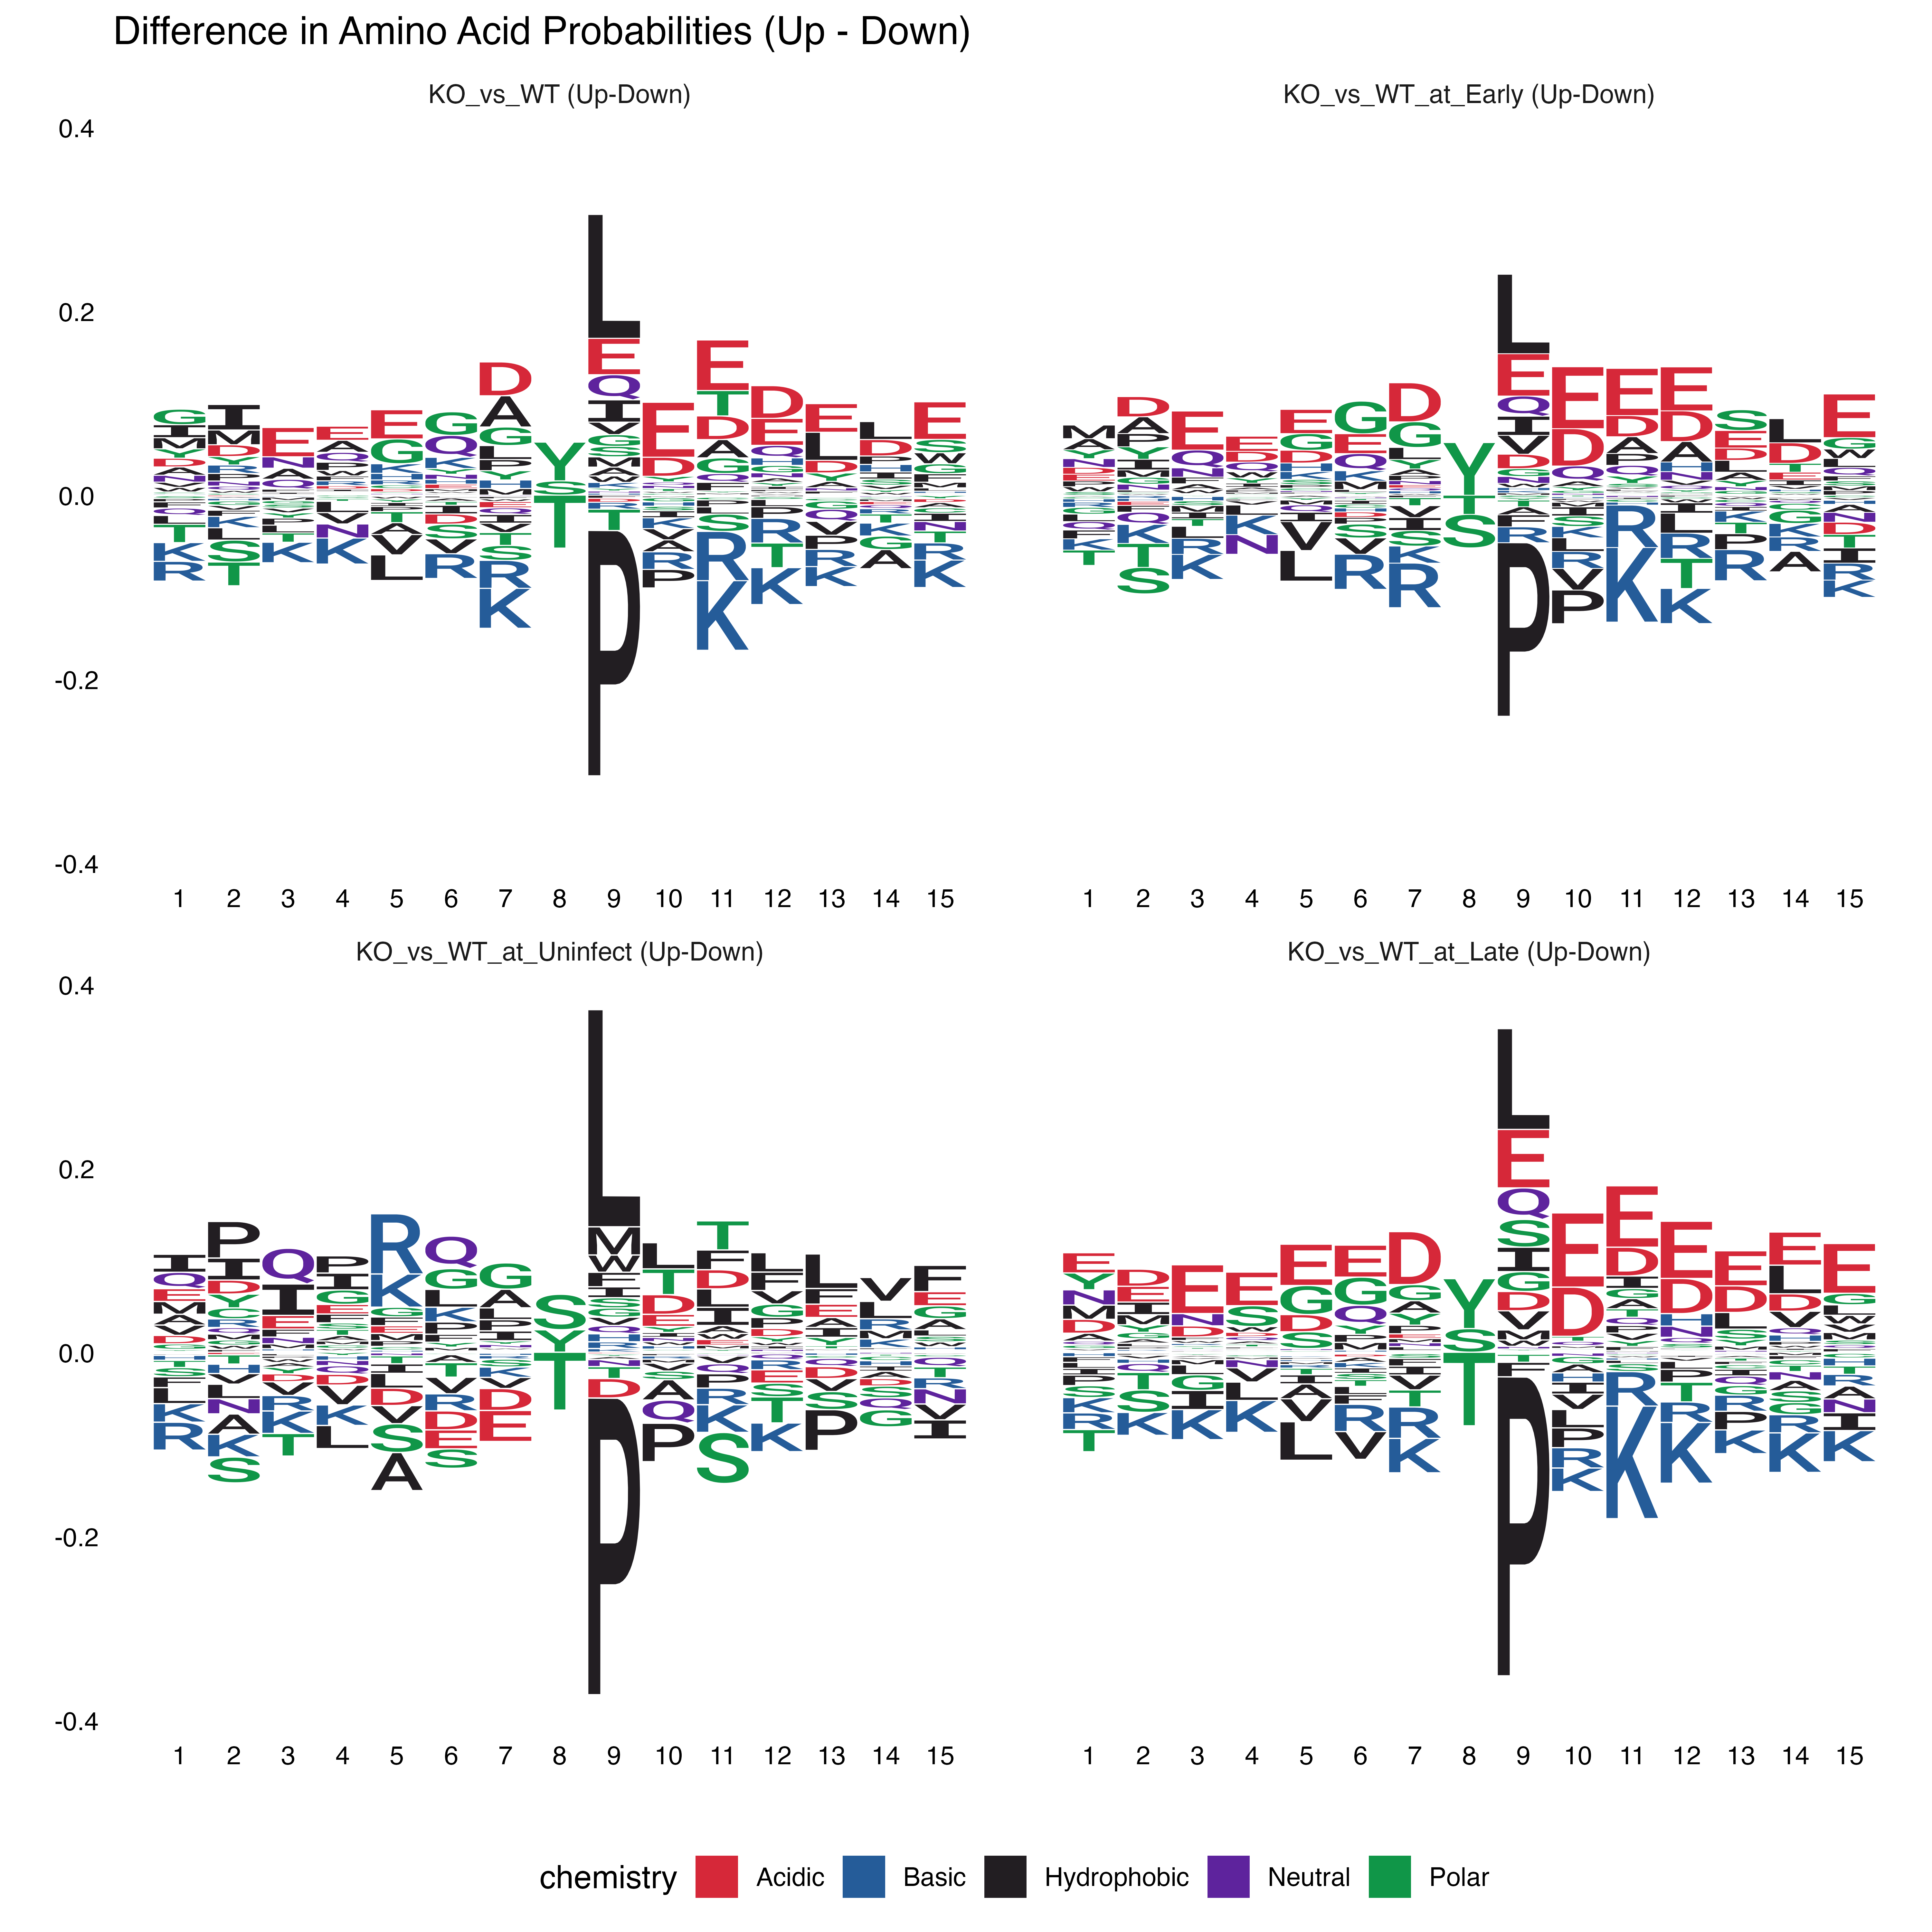
Difference Logos (Upregulated - Downregulated)
Results Summary
summary_info <- tibble(
  Metric = c("Analysis Type", "FDR Threshold", "FC Threshold",
             "Total Significant Sites", "Upregulated", "Downregulated"),
  Value = c(params$sheet, params$fdr, params$fc,
            nrow(significant_sites),
            sum(significant_sites$regulation == "upregulated"),
            sum(significant_sites$regulation == "downregulated"))
)
knitr::kable(summary_info, caption = "Analysis Summary")| Metric | Value |
|---|---|
| Analysis Type | DPA |
| FDR Threshold | 0.05 |
| FC Threshold | 0.6 |
| Total Significant Sites | 7269 |
| Upregulated | 3671 |
| Downregulated | 3598 |
Session Info
## R version 4.6.1 (2026-06-24)
## Platform: x86_64-pc-linux-gnu
## Running under: Ubuntu 24.04.4 LTS
##
## Matrix products: default
## BLAS:   /usr/lib/x86_64-linux-gnu/openblas-pthread/libblas.so.3
## LAPACK: /usr/lib/x86_64-linux-gnu/openblas-pthread/libopenblasp-r0.3.26.so;  LAPACK version 3.12.0
##
## locale:
##  [1] LC_CTYPE=C.UTF-8       LC_NUMERIC=C           LC_TIME=C.UTF-8
##  [4] LC_COLLATE=C.UTF-8     LC_MONETARY=C.UTF-8    LC_MESSAGES=C.UTF-8
##  [7] LC_PAPER=C.UTF-8       LC_NAME=C              LC_ADDRESS=C
## [10] LC_TELEPHONE=C         LC_MEASUREMENT=C.UTF-8 LC_IDENTIFICATION=C
##
## time zone: UTC
## tzcode source: system (glibc)
##
## attached base packages:
## [1] stats     graphics  grDevices utils     datasets  methods   base
##
## other attached packages:
## [1] prophosqua_0.3.0 readxl_1.5.0     ggseqlogo_0.2.2  dplyr_1.2.1
##
## loaded via a namespace (and not attached):
##  [1] gtable_0.3.6       jsonlite_2.0.0     compiler_4.6.1     tidyselect_1.2.1
##  [5] jquerylib_0.1.4    systemfonts_1.3.2  scales_1.4.0       textshaping_1.0.5
##  [9] yaml_2.3.12        fastmap_1.2.0      ggplot2_4.0.3      R6_2.6.1
## [13] labeling_0.4.3     patchwork_1.3.2    generics_0.1.4     knitr_1.51
## [17] forcats_1.0.1      htmlwidgets_1.6.4  tibble_3.3.1       bookdown_0.47
## [21] desc_1.4.3         bslib_0.11.0       pillar_1.11.1      RColorBrewer_1.1-3
## [25] rlang_1.3.0        cachem_1.1.0       xfun_0.60          S7_0.2.2
## [29] fs_2.1.0           sass_0.4.10        otel_0.2.0         cli_3.6.6
## [33] withr_3.0.3        pkgdown_2.2.1      magrittr_2.0.5     digest_0.6.39
## [37] grid_4.6.1         lifecycle_1.0.5    vctrs_0.7.3        evaluate_1.0.5
## [41] glue_1.8.1         cellranger_1.1.0   farver_2.1.2       ragg_1.5.2
## [45] purrr_1.2.2        rmarkdown_2.31     tools_4.6.1        pkgconfig_2.0.3
## [49] htmltools_0.5.9