N to C plot using ggplot2
Usage
n_to_c_plot(
  poi_matrix_min,
  protein_name,
  prot_length,
  contrast,
  thr_a = 0.05,
  thr_b = 0.2,
  color_protein = "yellow"
)
Arguments
- poi_matrix_min
data.frame with phosphorylation data
- protein_name
name of protein
- prot_length
protein length
- contrast
name of contrast
- thr_a
significance threshold (strict), default 0.05
- thr_b
significance threshold (lenient), default 0.20
- color_protein
color for protein-level bar (default: "yellow")
Examples
data(exampleN_C_dat)
# Prepare data for plotting
poi_matrix_min <- prepare_n_to_c_data(exampleN_C_dat)
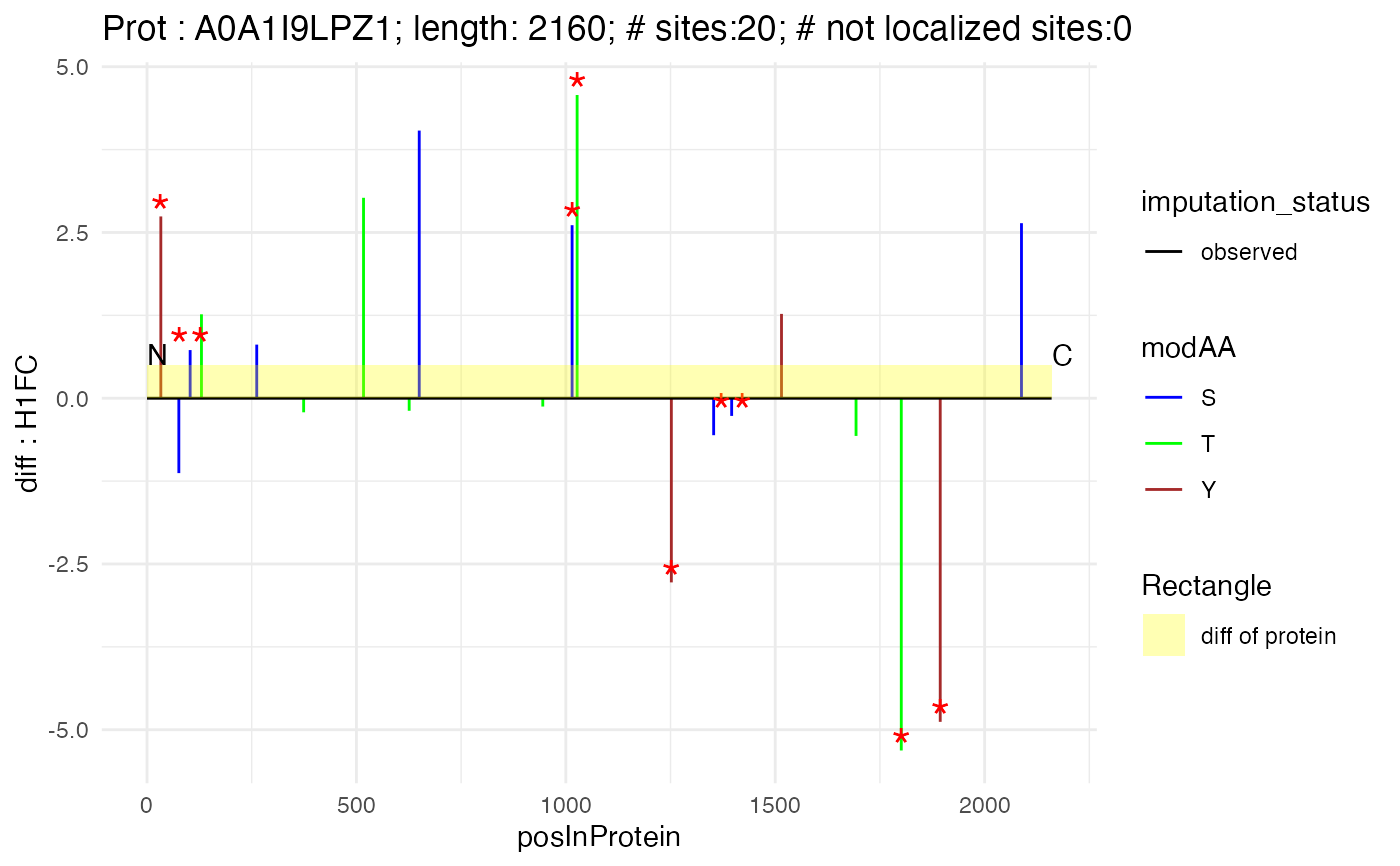
n_to_c_plot(subset(poi_matrix_min, protein_Id == "A0A1I9LPZ1"), "A0A1I9LPZ1", 2160, "H1FC")
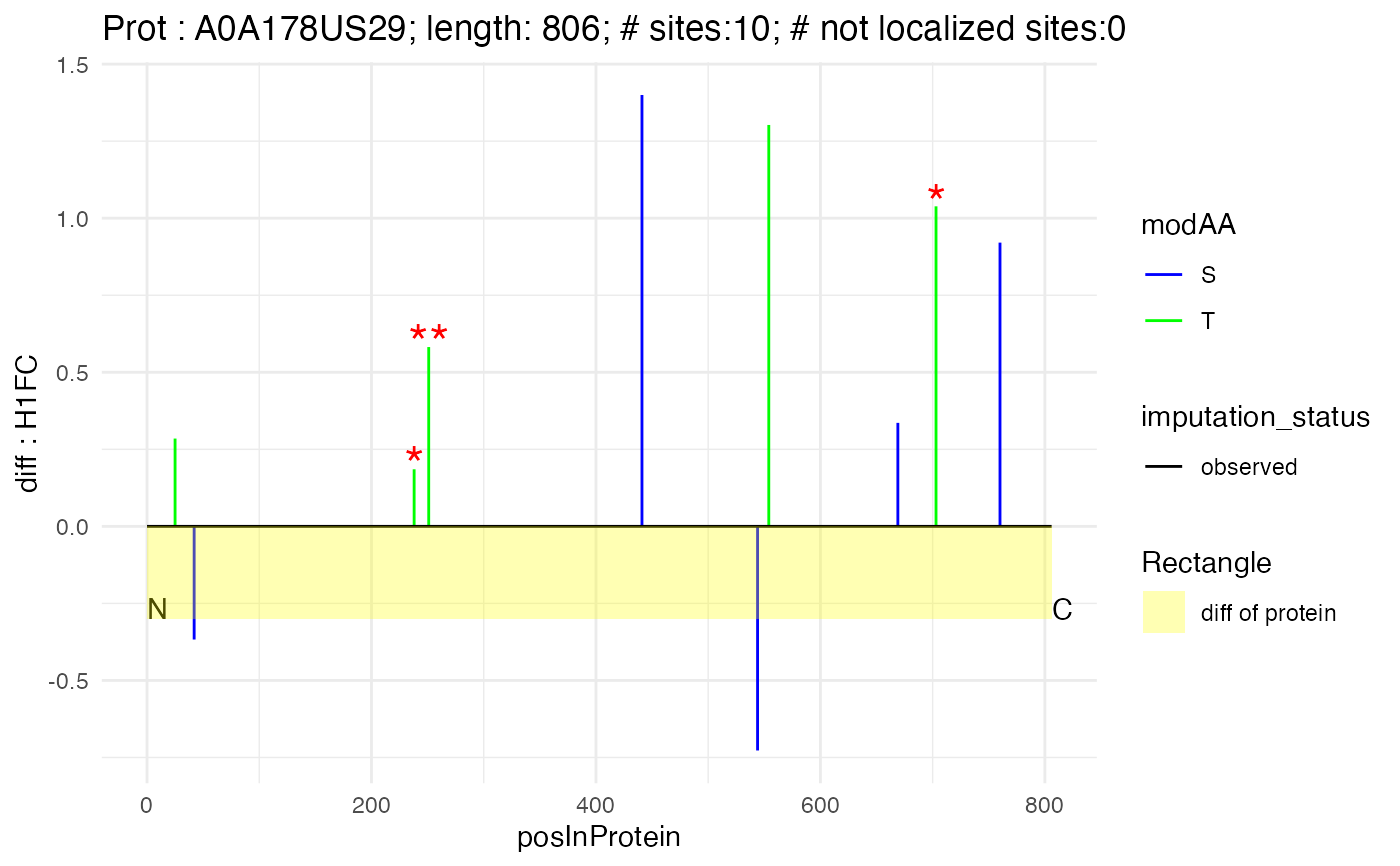
 n_to_c_plot(subset(poi_matrix_min, protein_Id == "A0A178US29"), "A0A178US29", 806, "H1FC")