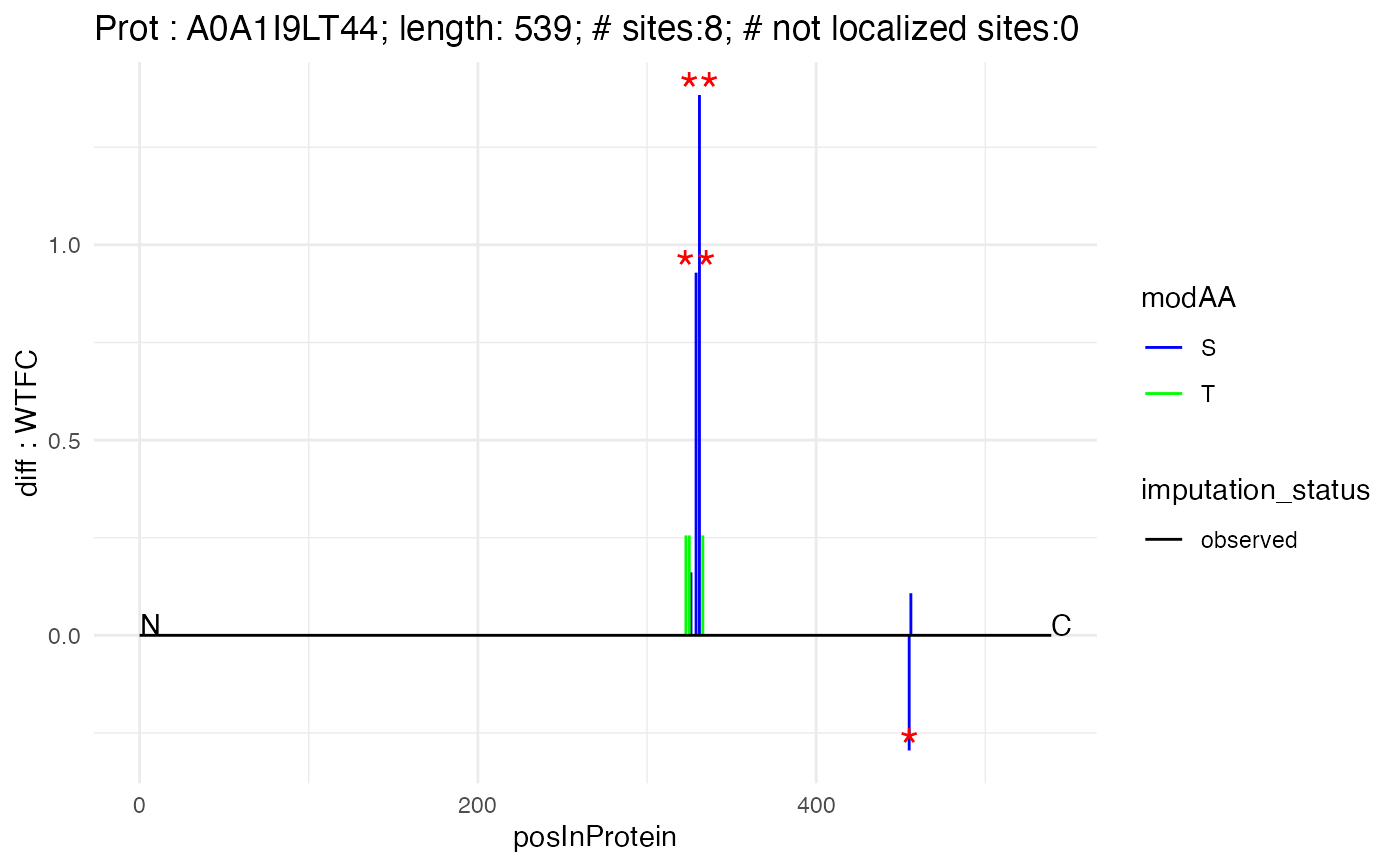
N to C plot for integrated (DPU) results
Usage
n_to_c_plot_integrated(
  poi_matrix_min,
  protein_name,
  prot_length,
  contrast,
  thr_a = 0.05,
  thr_b = 0.2,
  color_protein = "yellow"
)
Arguments
- poi_matrix_min
data.frame with integrated phospho/protein data
- protein_name
name of protein
- prot_length
protein length
- contrast
name of contrast
- thr_a
significance threshold (strict), default 0.05
- thr_b
significance threshold (lenient), default 0.20
- color_protein
color for protein-level bar (default: "yellow")
Examples
data(n_c_integrated_df)
n_c_integrated_df$imputation_status <- "observed"
n_to_c_plot_integrated(n_c_integrated_df, "A0A1I9LT44", 539, "WTFC")