Create enrichment dotplot for top items by FDR
Source:R/enrichment_visualization.R
plot_enrichment_dotplot.RdCreate enrichment dotplot for top items by FDR
Usage
plot_enrichment_dotplot(
  data,
  item_col = "kinase",
  fdr_col = "FDR",
  n_top = 30,
  title = NULL,
  subtitle = "Top 30 by FDR"
)Examples
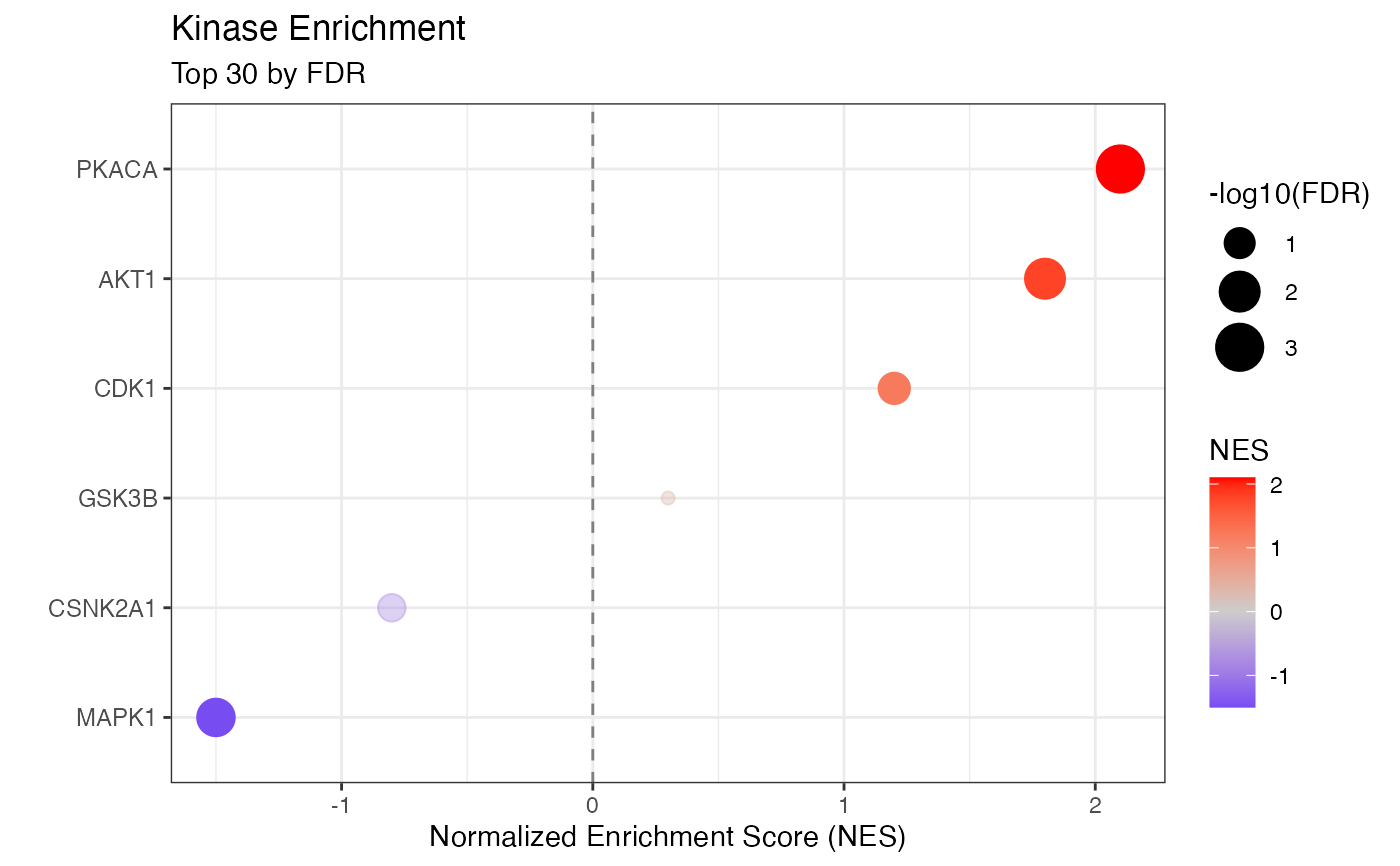
# Kinase enrichment results (e.g., from KinaseLibrary)
kinase_results <- data.frame(
kinase = c("PKACA", "AKT1", "MAPK1", "CDK1", "CSNK2A1", "GSK3B"),
NES = c(2.1, 1.8, -1.5, 1.2, -0.8, 0.3),
FDR = c(0.001, 0.01, 0.02, 0.08, 0.15, 0.45)
)
plot_enrichment_dotplot(kinase_results, n_top = 6, title = "Kinase Enrichment")
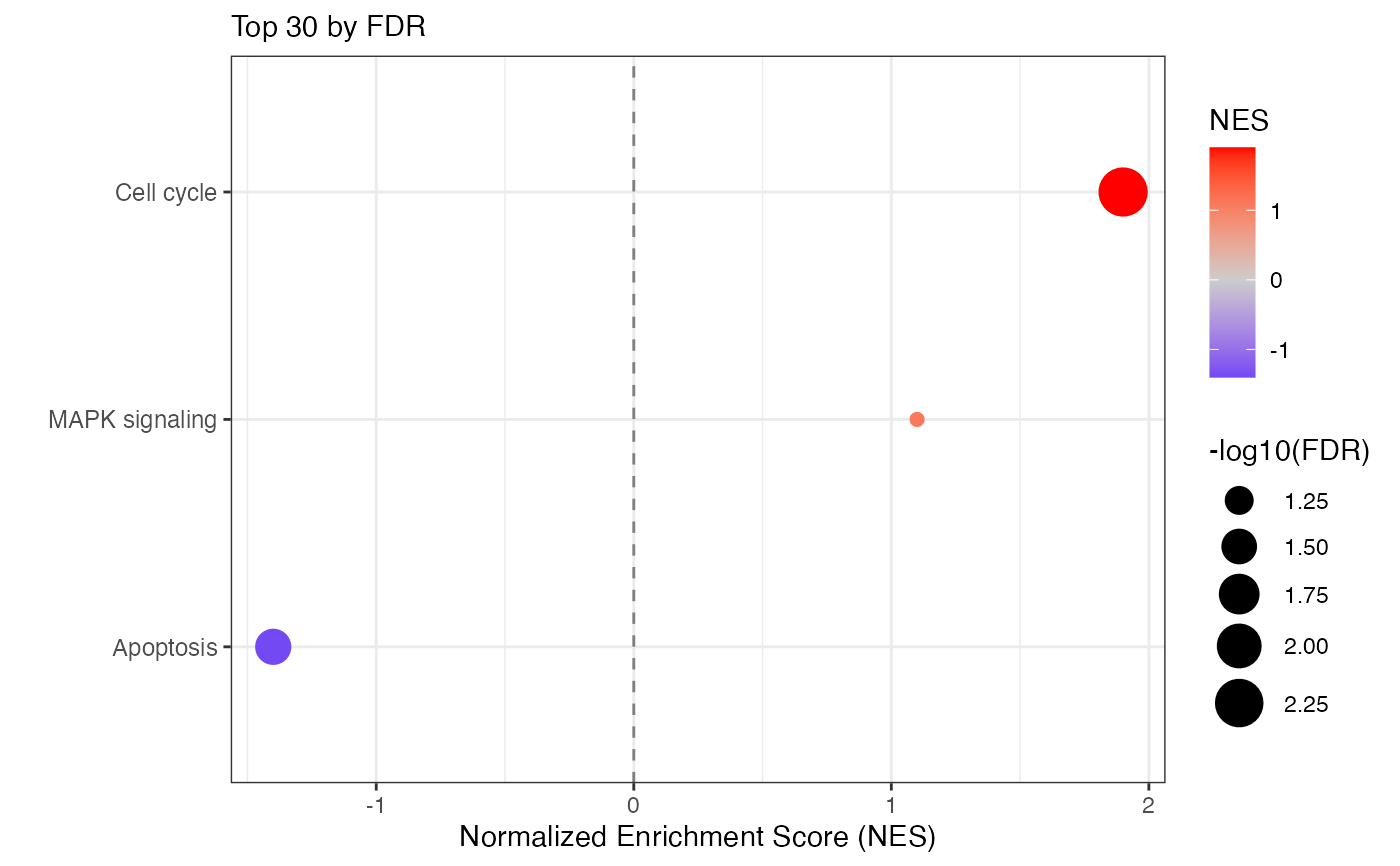
 # Pathway enrichment with custom column names
pathway_results <- data.frame(
pathway = c("Cell cycle", "Apoptosis", "MAPK signaling"),
NES = c(1.9, -1.4, 1.1),
p.adjust = c(0.005, 0.03, 0.09)
)
plot_enrichment_dotplot(pathway_results, item_col = "pathway",
fdr_col = "p.adjust", n_top = 3)
# Pathway enrichment with custom column names
pathway_results <- data.frame(
pathway = c("Cell cycle", "Apoptosis", "MAPK signaling"),
NES = c(1.9, -1.4, 1.1),
p.adjust = c(0.005, 0.03, 0.09)
)
plot_enrichment_dotplot(pathway_results, item_col = "pathway",
fdr_col = "p.adjust", n_top = 3)