Create volcano plot for enrichment results
Source:R/enrichment_visualization.R
plot_enrichment_volcano.RdCreate volcano plot for enrichment results
Usage
plot_enrichment_volcano(
  data,
  item_col = "kinase",
  fdr_col = "FDR",
  fdr_threshold = 0.1,
  label_fdr_threshold = 0.05,
  n_labels = 5,
  title = NULL,
  subtitle = NULL
)
Arguments
- data
Data frame with columns: NES, p.adjust/FDR, contrast, item (kinase/pathway)
- item_col
Name of item column for labels (default: "kinase")
- fdr_col
Name of FDR column (default: "FDR")
- fdr_threshold
FDR threshold for significance line (default: 0.1)
- label_fdr_threshold
FDR threshold for labeling points (default: 0.05)
- n_labels
Number of top labels per contrast (default: 5)
- title
Plot title
- subtitle
Plot subtitle
Examples
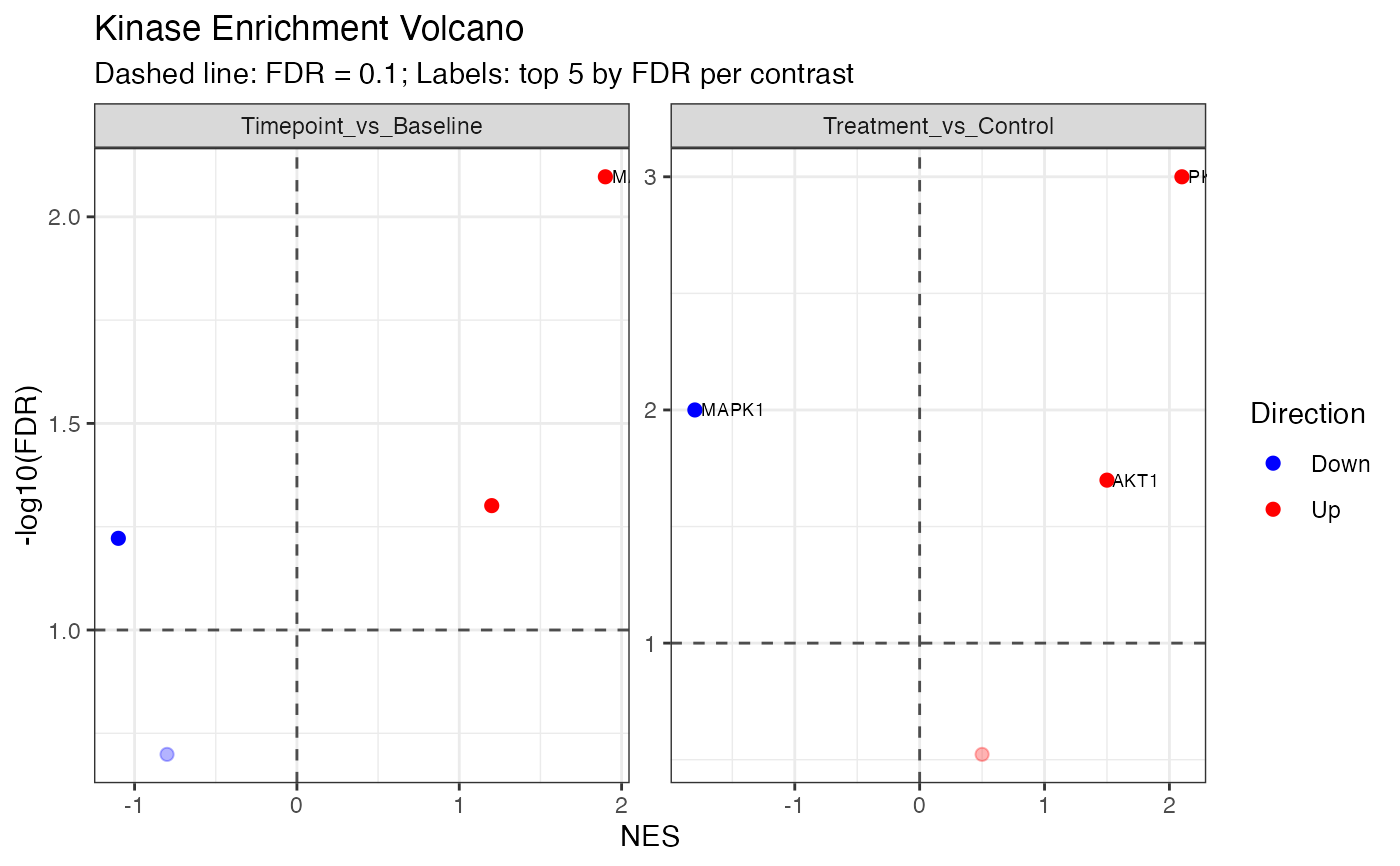
# Multi-contrast kinase enrichment results
kinase_results <- data.frame(
kinase = rep(c("PKACA", "AKT1", "MAPK1", "CDK1"), 2),
NES = c(2.1, 1.5, -1.8, 0.5, 1.2, -0.8, 1.9, -1.1),
FDR = c(0.001, 0.02, 0.01, 0.3, 0.05, 0.2, 0.008, 0.06),
contrast = rep(c("Treatment_vs_Control", "Timepoint_vs_Baseline"), each = 4)
)
plot_enrichment_volcano(kinase_results, title = "Kinase Enrichment Volcano")
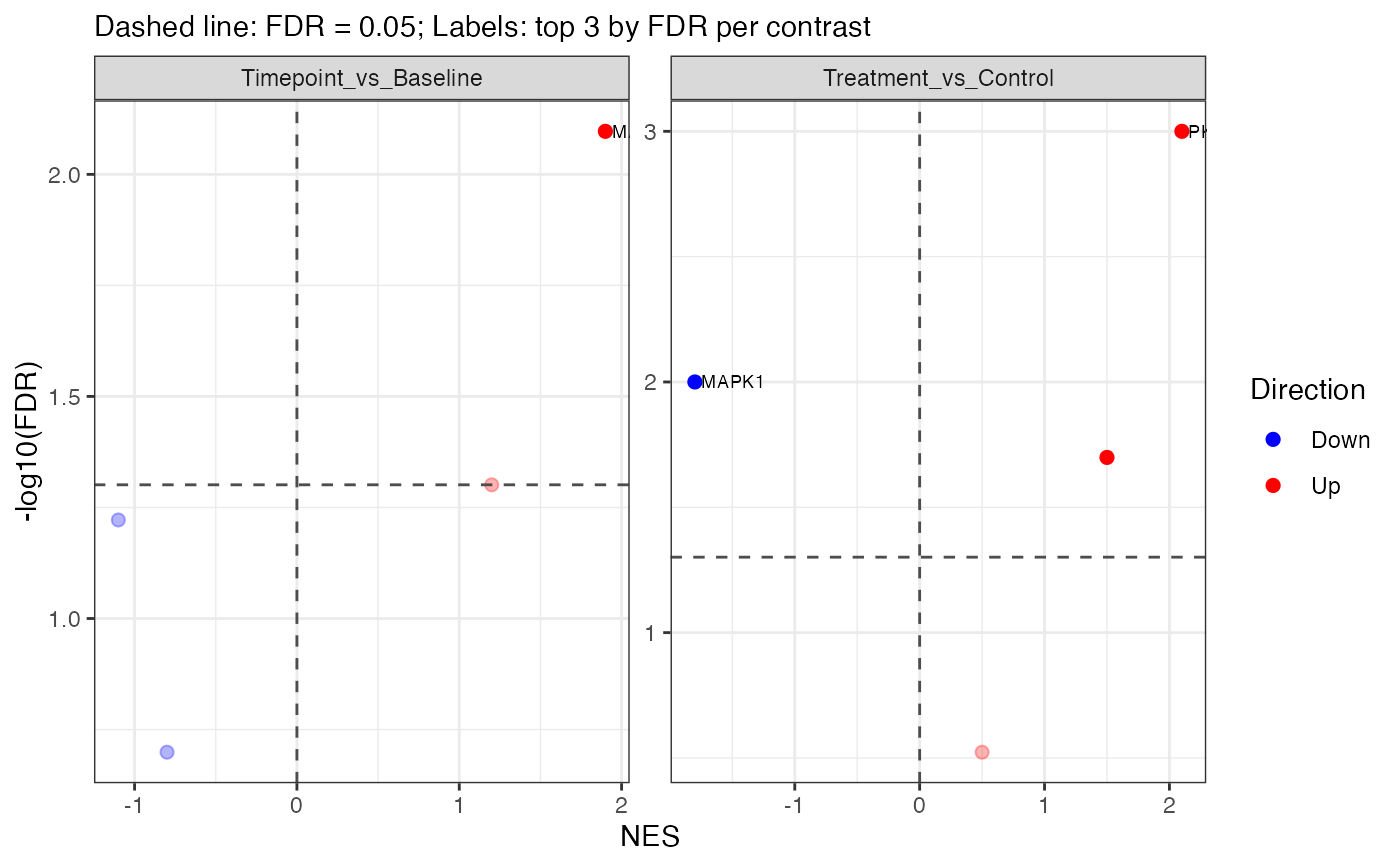
 # Customize labeling thresholds
plot_enrichment_volcano(kinase_results, fdr_threshold = 0.05,
label_fdr_threshold = 0.02, n_labels = 3)
# Customize labeling thresholds
plot_enrichment_volcano(kinase_results, fdr_threshold = 0.05,
label_fdr_threshold = 0.02, n_labels = 3)