Protein Signal Intensities within Groups
The CompMS team
2026-06-23
Source:vignettes/QC_ProteinAbundances.Rmd
QC_ProteinAbundances.Rmd- Order :
- Workunit :
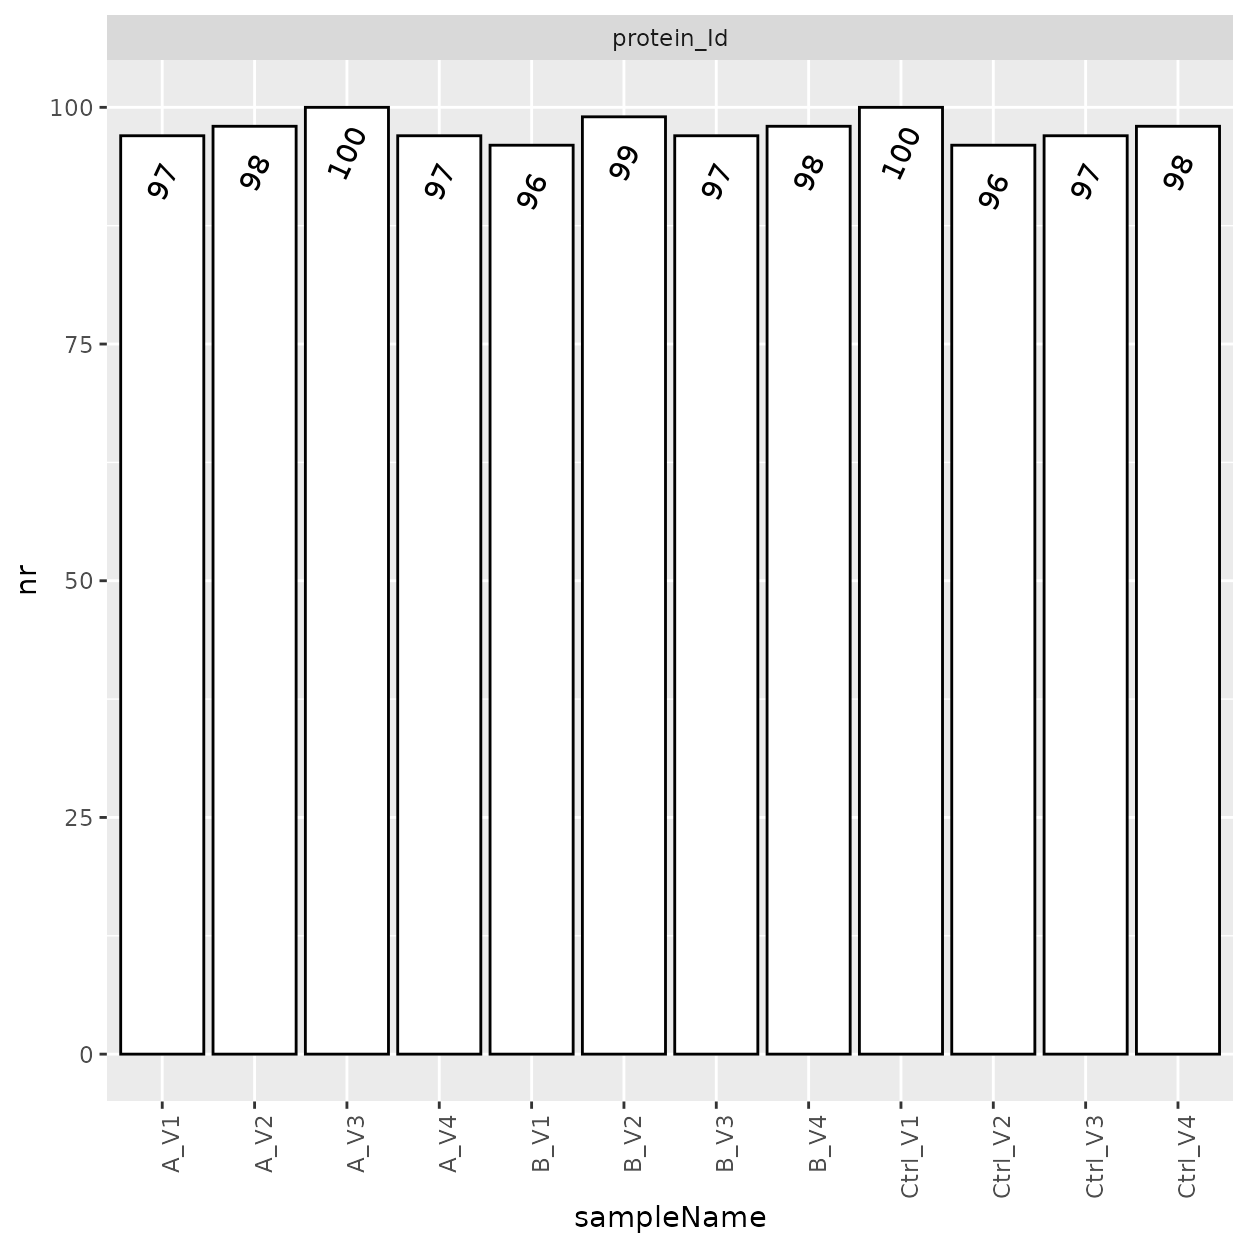
Number of proteins per Sample.
The columns of the table below contains:
- protein_Id - protein identifier
- nrPeptides - nr of peptides per protein
- description - protein description from fasta header
- nrMeasured_
- How often a protein was observed in each of the groups and overall - meanAbundance_
- average protein abundance (see 1. at the bottom of the document) per group. - signal_percent_
- percent of the total signal of all identified proteins measured by the mass spectrometric instrument attributed to each protein.
(ref:proteinCumulative) The Y axis presents the percentage of the iBAQ (intensity Based Absolute Quantitation) of each protein. Along the X axis, proteins are organized in ascending order according to their signal proportions.
Calculating the iBAQ signal per protein involves summing the
Precursor.Quantity values across all precursors associated
with that protein and dividing by the number of theoretically observable
peptides of the protein. An intriguing observation is that a significant
share of the mass spectrometers recorded signal (Y-axis) is allocated to
a limited set of highly abundant proteins. Notably, when the most
abundant proteins correspond to entities like the cleavage enzyme,
typical contaminants such as human keratins, or the bait protein, this
situation could indicate shortcomings in the sample processing.
(ref:proteinCumulative)
(ref:nrProtplots) Mean protein abundance per group (column
meanAbundance_