Plot relative protein abundance as a function of rank by abundance
Source:R/plot_abundance_vs_percent.R
plot_abundance_vs_percent.RdPlot relative protein abundance as a function of rank by abundance
Usage
plot_abundance_vs_percent(
  percInfo,
  cfg_config,
  top_N = 10,
  factors = TRUE,
  colors = c(`^REV_` = "red", `^CON_` = "orange"),
  columnAb = "abundance_percent",
  group = "BB",
  alpha = 1,
  logY = TRUE
)
Arguments
- percInfo
data frame with percentage abundance info
- cfg_config
AnalysisConfiguration object
- top_N
number of top proteins to label
- factors
if TRUE facet by factors
- colors
named vector of colors for special proteins
- columnAb
column name for abundance values
- group
crosstalk group identifier
- alpha
point transparency
- logY
if TRUE use log10 y-axis
Examples
library(prolfqua)
istar <- prolfqua::prolfqua_data('data_ionstar')$filtered()
#> Column added : nr_peptide_Id_IN_protein_Id
data <- istar$data |> dplyr::filter(protein_Id %in% sample(protein_Id, 100))
lfqdata <- prolfqua::LFQData$new(data, istar$config)
sr <- lfqdata$get_Summariser()
undebug(plot_abundance_vs_percent)
#> Warning: argument is not being debugged
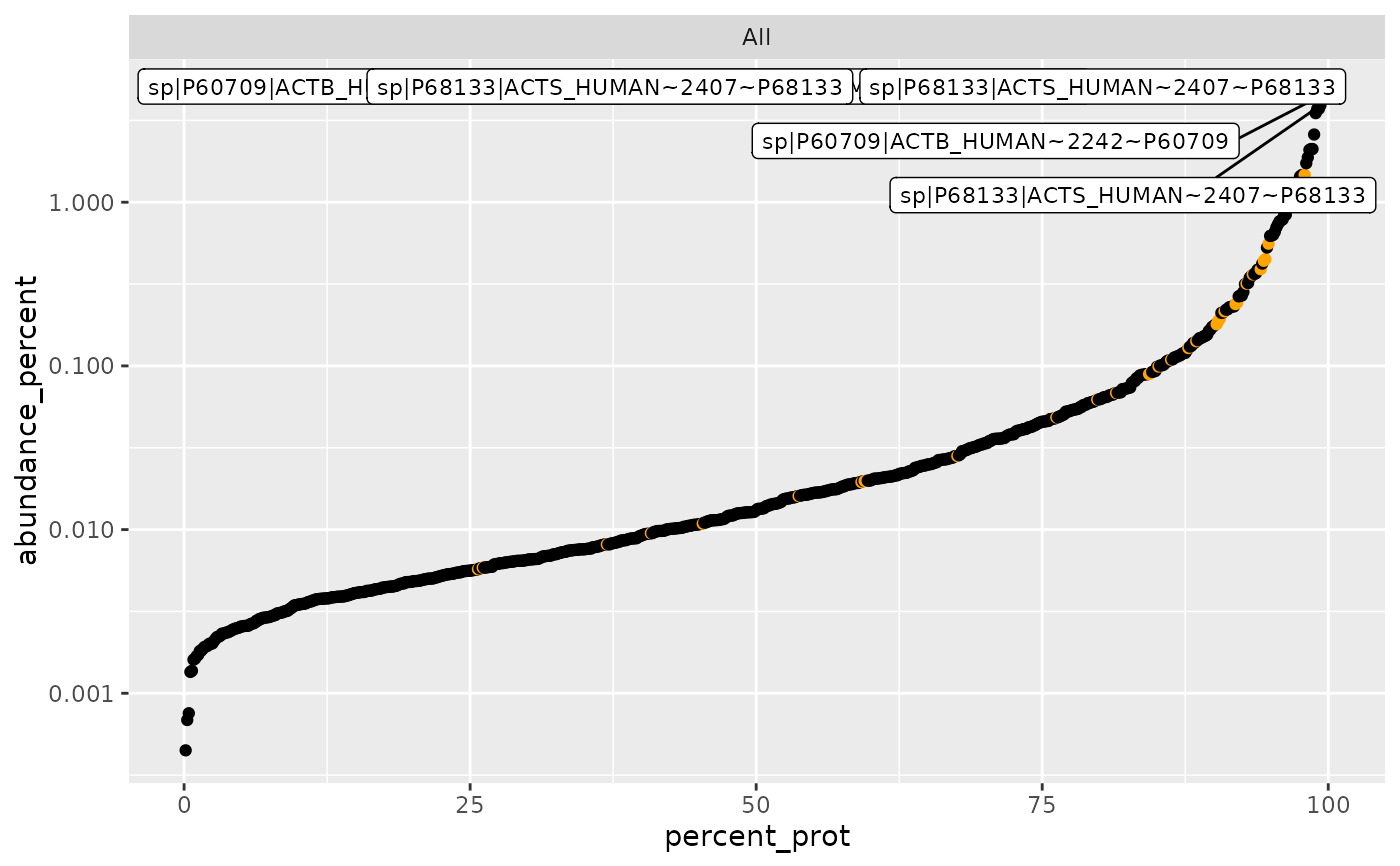
plot_abundance_vs_percent(sr$percentage_abundance(),
lfqdata$get_config(),
top_N = 6, factors = FALSE, logY = TRUE)
 pd <- plot_abundance_vs_percent(
sr$percentage_abundance(),
lfqdata$get_config(), top_N = NULL, factors = FALSE)
#> creating shared data with key : ~ protein_Id
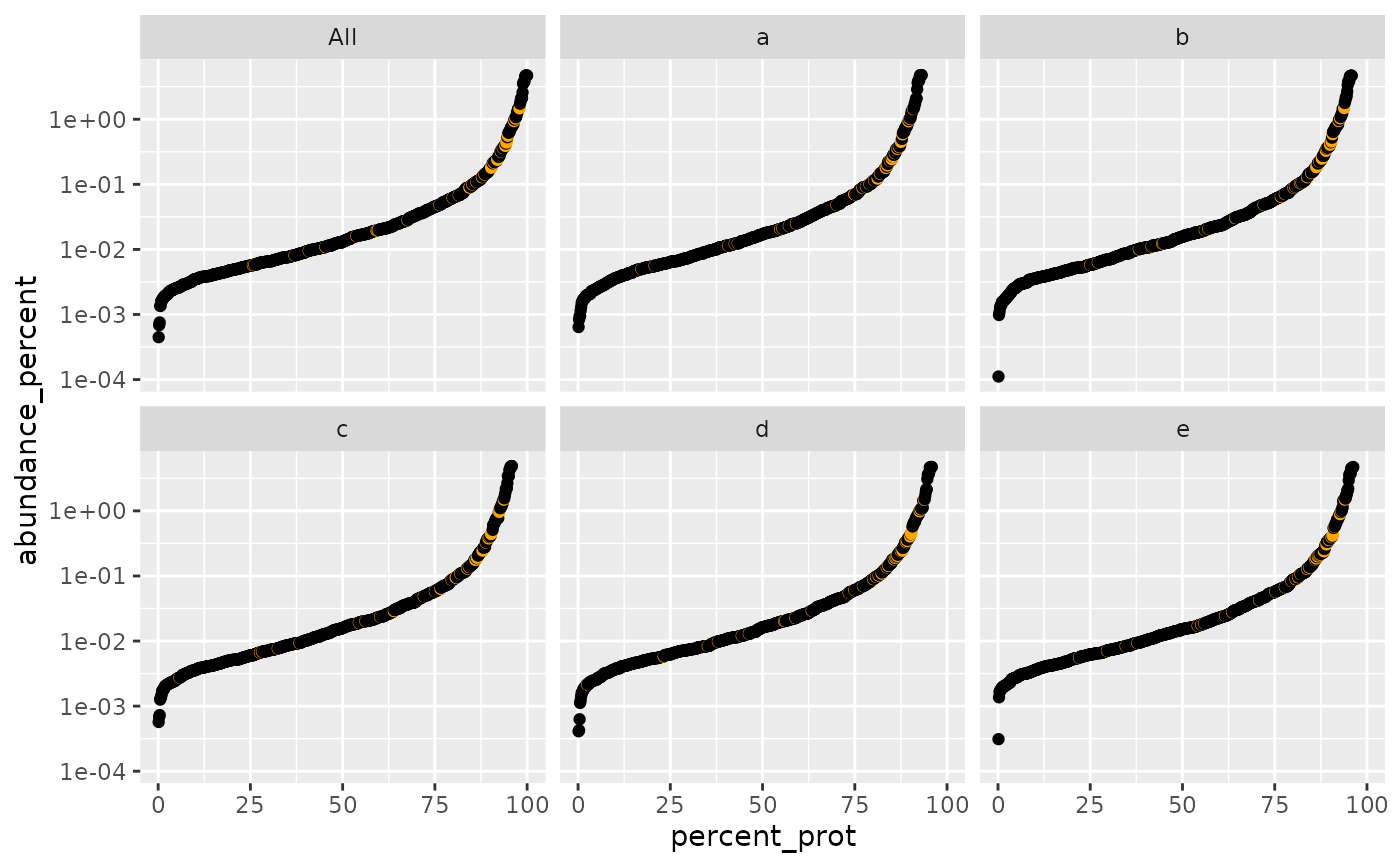
plot_abundance_vs_percent(
sr$percentage_abundance(),
lfqdata$get_config(), top_N = 4, factors = TRUE)
#> Warning: Removed 208 rows containing missing values or values outside the scale range
#> (`geom_point()`).
pd <- plot_abundance_vs_percent(
sr$percentage_abundance(),
lfqdata$get_config(), top_N = NULL, factors = FALSE)
#> creating shared data with key : ~ protein_Id
plot_abundance_vs_percent(
sr$percentage_abundance(),
lfqdata$get_config(), top_N = 4, factors = TRUE)
#> Warning: Removed 208 rows containing missing values or values outside the scale range
#> (`geom_point()`).
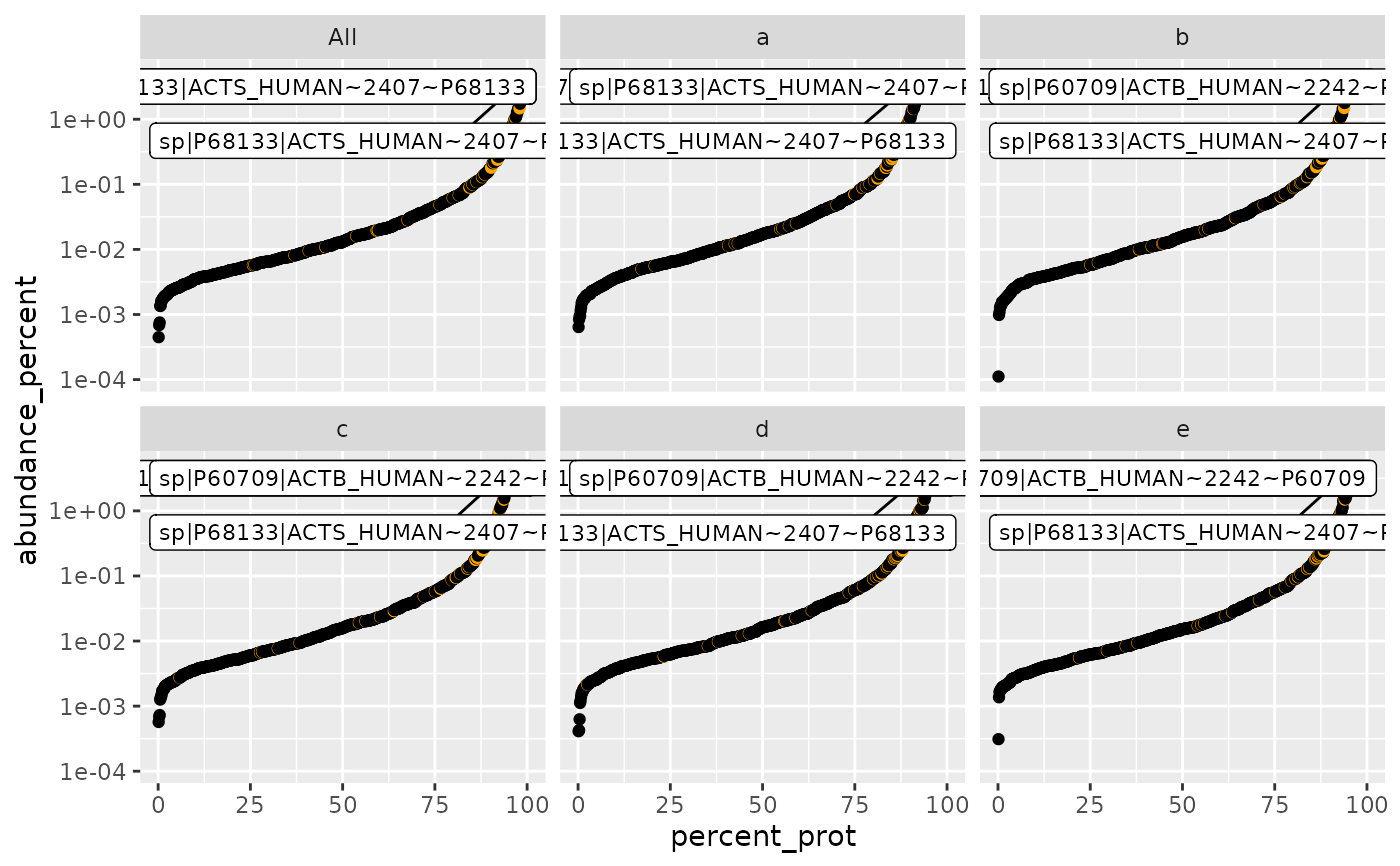 plot_abundance_vs_percent(
sr$percentage_abundance(),
lfqdata$get_config(), top_N = NULL, factors = TRUE)
#> creating shared data with key : ~ protein_Id
#> Warning: Removed 208 rows containing missing values or values outside the scale range
#> (`geom_point()`).
plot_abundance_vs_percent(
sr$percentage_abundance(),
lfqdata$get_config(), top_N = NULL, factors = TRUE)
#> creating shared data with key : ~ protein_Id
#> Warning: Removed 208 rows containing missing values or values outside the scale range
#> (`geom_point()`).