Kinase Activity (Kinase Library + MEA)
DPA
FGCZ
29 July, 2026
Source:vignettes/Analysis_MEA.Rmd
Analysis_MEA.RmdOverview
Motif Enrichment Analysis (MEA) results for DPA analysis using the kinase-library package.
MEA identifies kinases whose known substrate motifs are enriched at the extremes of ranked phosphoproteomics data, indicating altered kinase activity.
Load MEA Results
if (pipeline_mode) {
  # Pipeline mode: load from kinaselib directory
  mea_files <- list.files(params$kinaselib_dir, pattern = "^mea_.*\\.csv$", full.names = TRUE)

  if (length(mea_files) == 0) {
    stop("No MEA result files found in: ", params$kinaselib_dir)
  }

  # Load all MEA results
  mea_results <- mea_files |>
    set_names(gsub("^mea_|\\.csv$", "", basename(mea_files))) |>
    map_dfr(~ read.csv(.x, stringsAsFactors = FALSE), .id = "contrast")

  output_dir <- params$kinaselib_dir
} else {
  # Vignette mode: use bundled example data
  bundled_zip <- system.file("extdata", "mea_results.zip", package = "prophosqua")

  if (!file.exists(bundled_zip)) {
    stop("Bundled MEA example data not found. Run in pipeline mode with actual data.")
  }

  temp_dir <- tempdir()
  unzip(bundled_zip, exdir = temp_dir)
  mea_files <- list.files(temp_dir, pattern = "^mea_.*\\.csv$", full.names = TRUE)

  mea_results <- mea_files |>
    set_names(gsub("^mea_|\\.csv$", "", basename(mea_files))) |>
    map_dfr(~ read.csv(.x, stringsAsFactors = FALSE), .id = "contrast")

  output_dir <- tempdir()
  message("Using bundled MEA example data from prophosqua package")
}

# Standardize column names (MEA output uses Kinase, we need kinase)
if ("Kinase" %in% names(mea_results)) {
  mea_results <- mea_results |> rename(kinase = Kinase)
}
if ("p.value" %in% names(mea_results)) {
  mea_results <- mea_results |> rename(pvalue = `p.value`)
} else if ("p-value" %in% names(mea_results)) {
  mea_results <- mea_results |> rename(pvalue = `p-value`)
}
# Rename size column if present
if ("Subs.fraction" %in% names(mea_results)) {
  mea_results <- mea_results |> mutate(size = as.numeric(sub("/.*", "", `Subs.fraction`)))
} else if ("Subs fraction" %in% names(mea_results)) {
  mea_results <- mea_results |> mutate(size = as.numeric(sub("/.*", "", `Subs fraction`)))
}

cat("Loaded", nrow(mea_results), "results from", length(mea_files), "contrasts\n")
## Loaded 622 results from 2 contrasts## Contrasts: KO_vs_WT_at_Early, KO_vs_WT
# Clean and prepare results using shared helper
mea_clean <- prepare_enrichment_data(mea_results, "FDR", 0.1)

# Summary
summary_df <- mea_clean |>
  group_by(contrast) |>
  summarize(
    total_kinases = n(),
    sig_up = sum(FDR < 0.1 & NES > 0, na.rm = TRUE),
    sig_down = sum(FDR < 0.1 & NES < 0, na.rm = TRUE),
    .groups = "drop"
  )

knitr::kable(summary_df, caption = paste("MEA Summary -", params$analysis_type))| contrast | total_kinases | sig_up | sig_down |
|---|---|---|---|
| KO_vs_WT | 311 | 79 | 58 |
| KO_vs_WT_at_Early | 311 | 55 | 118 |
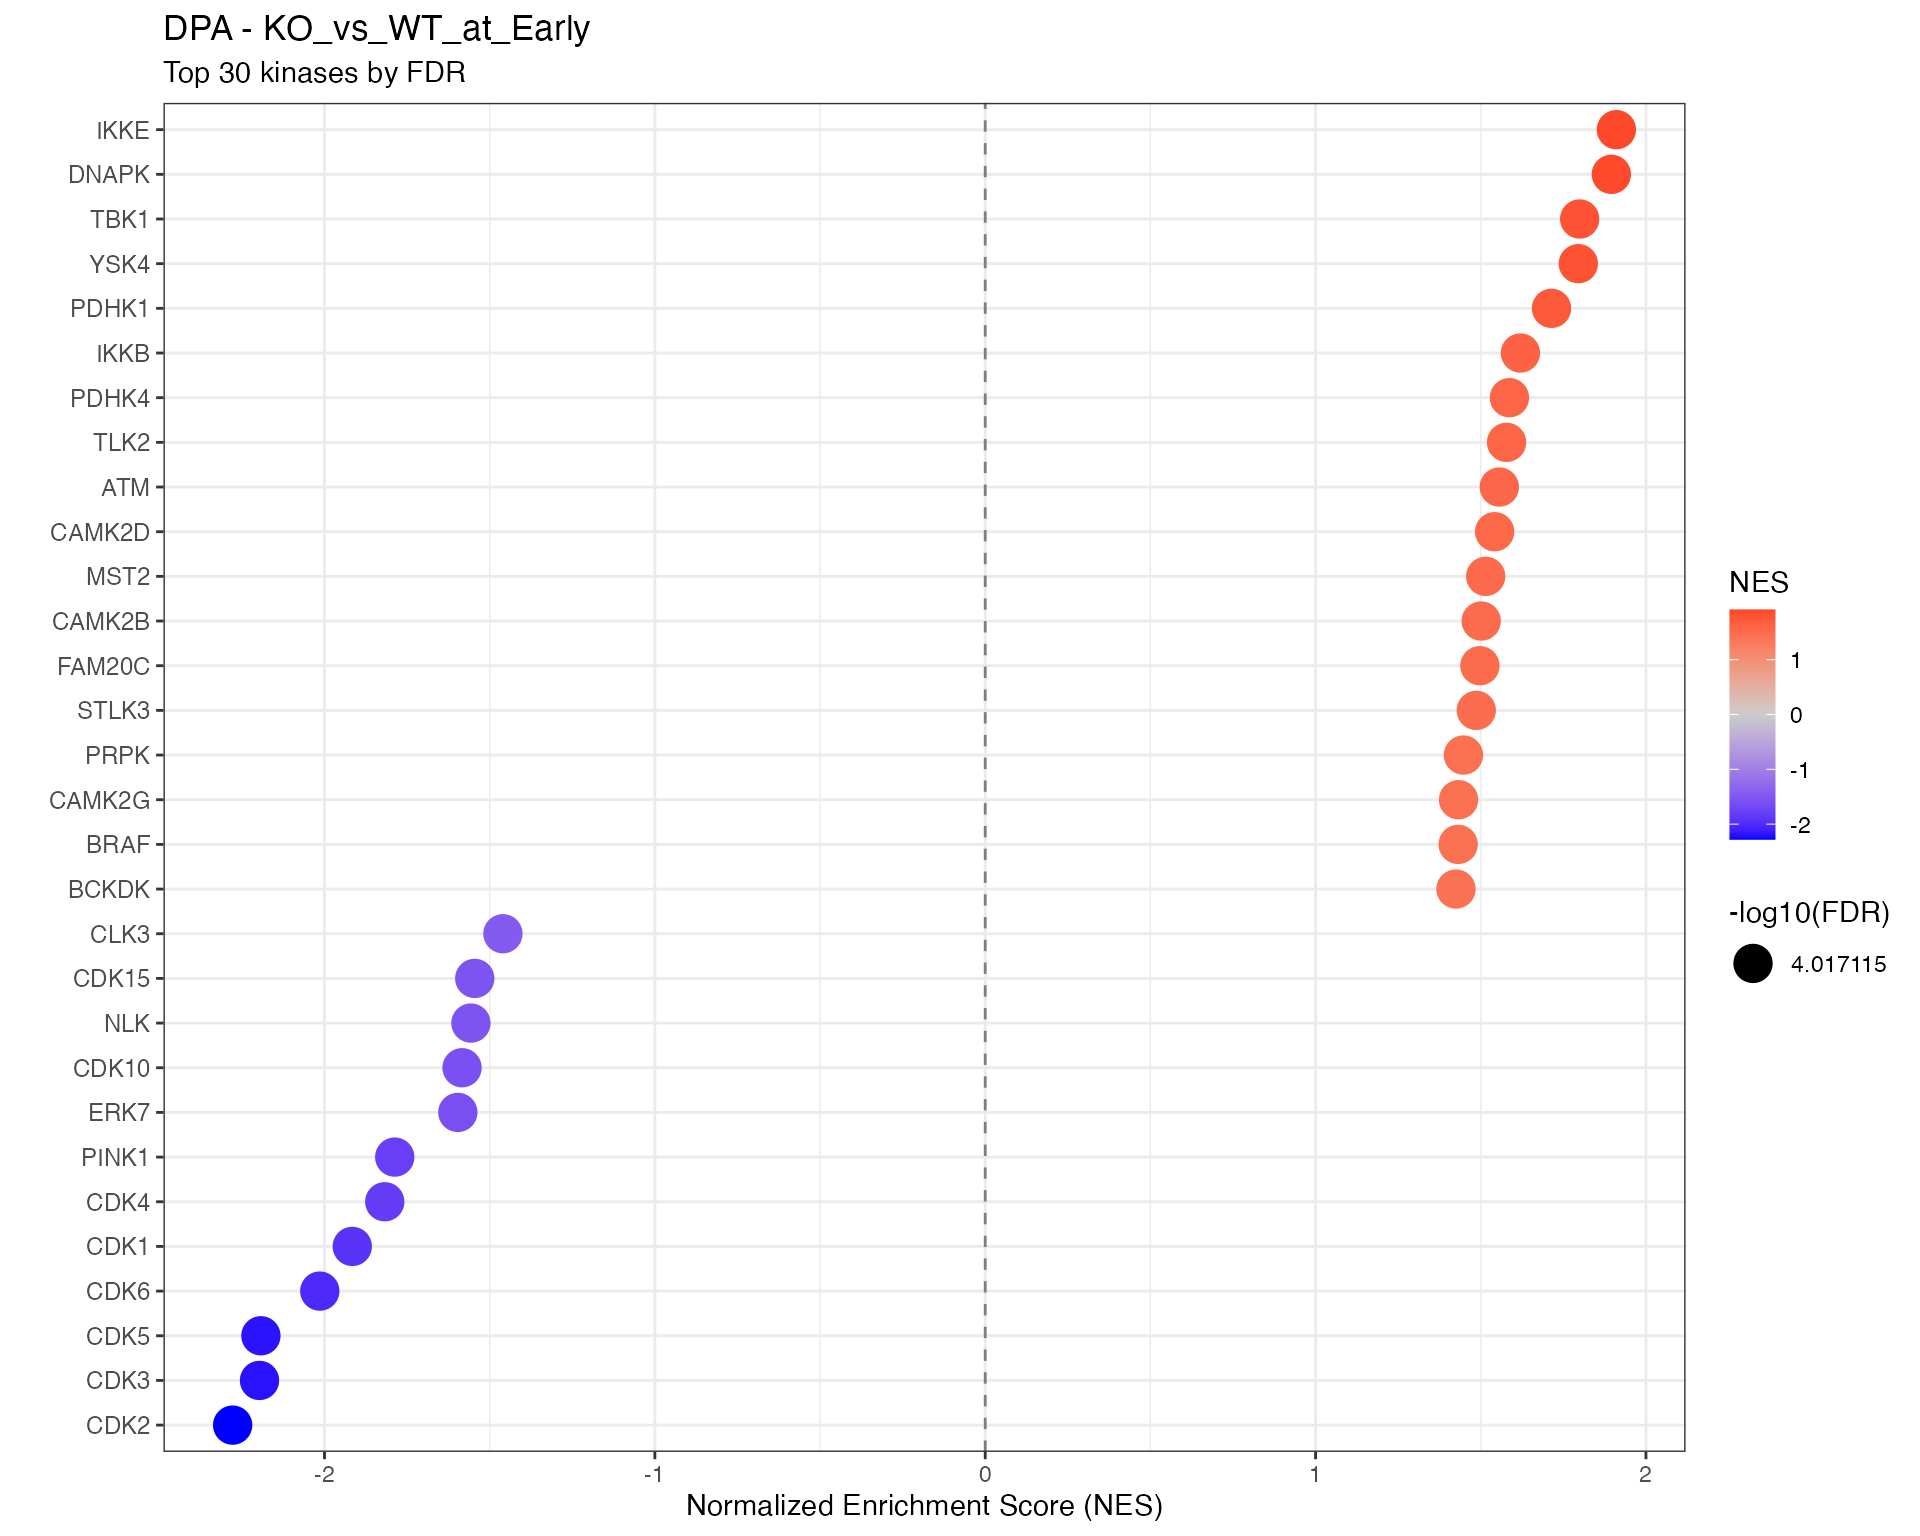
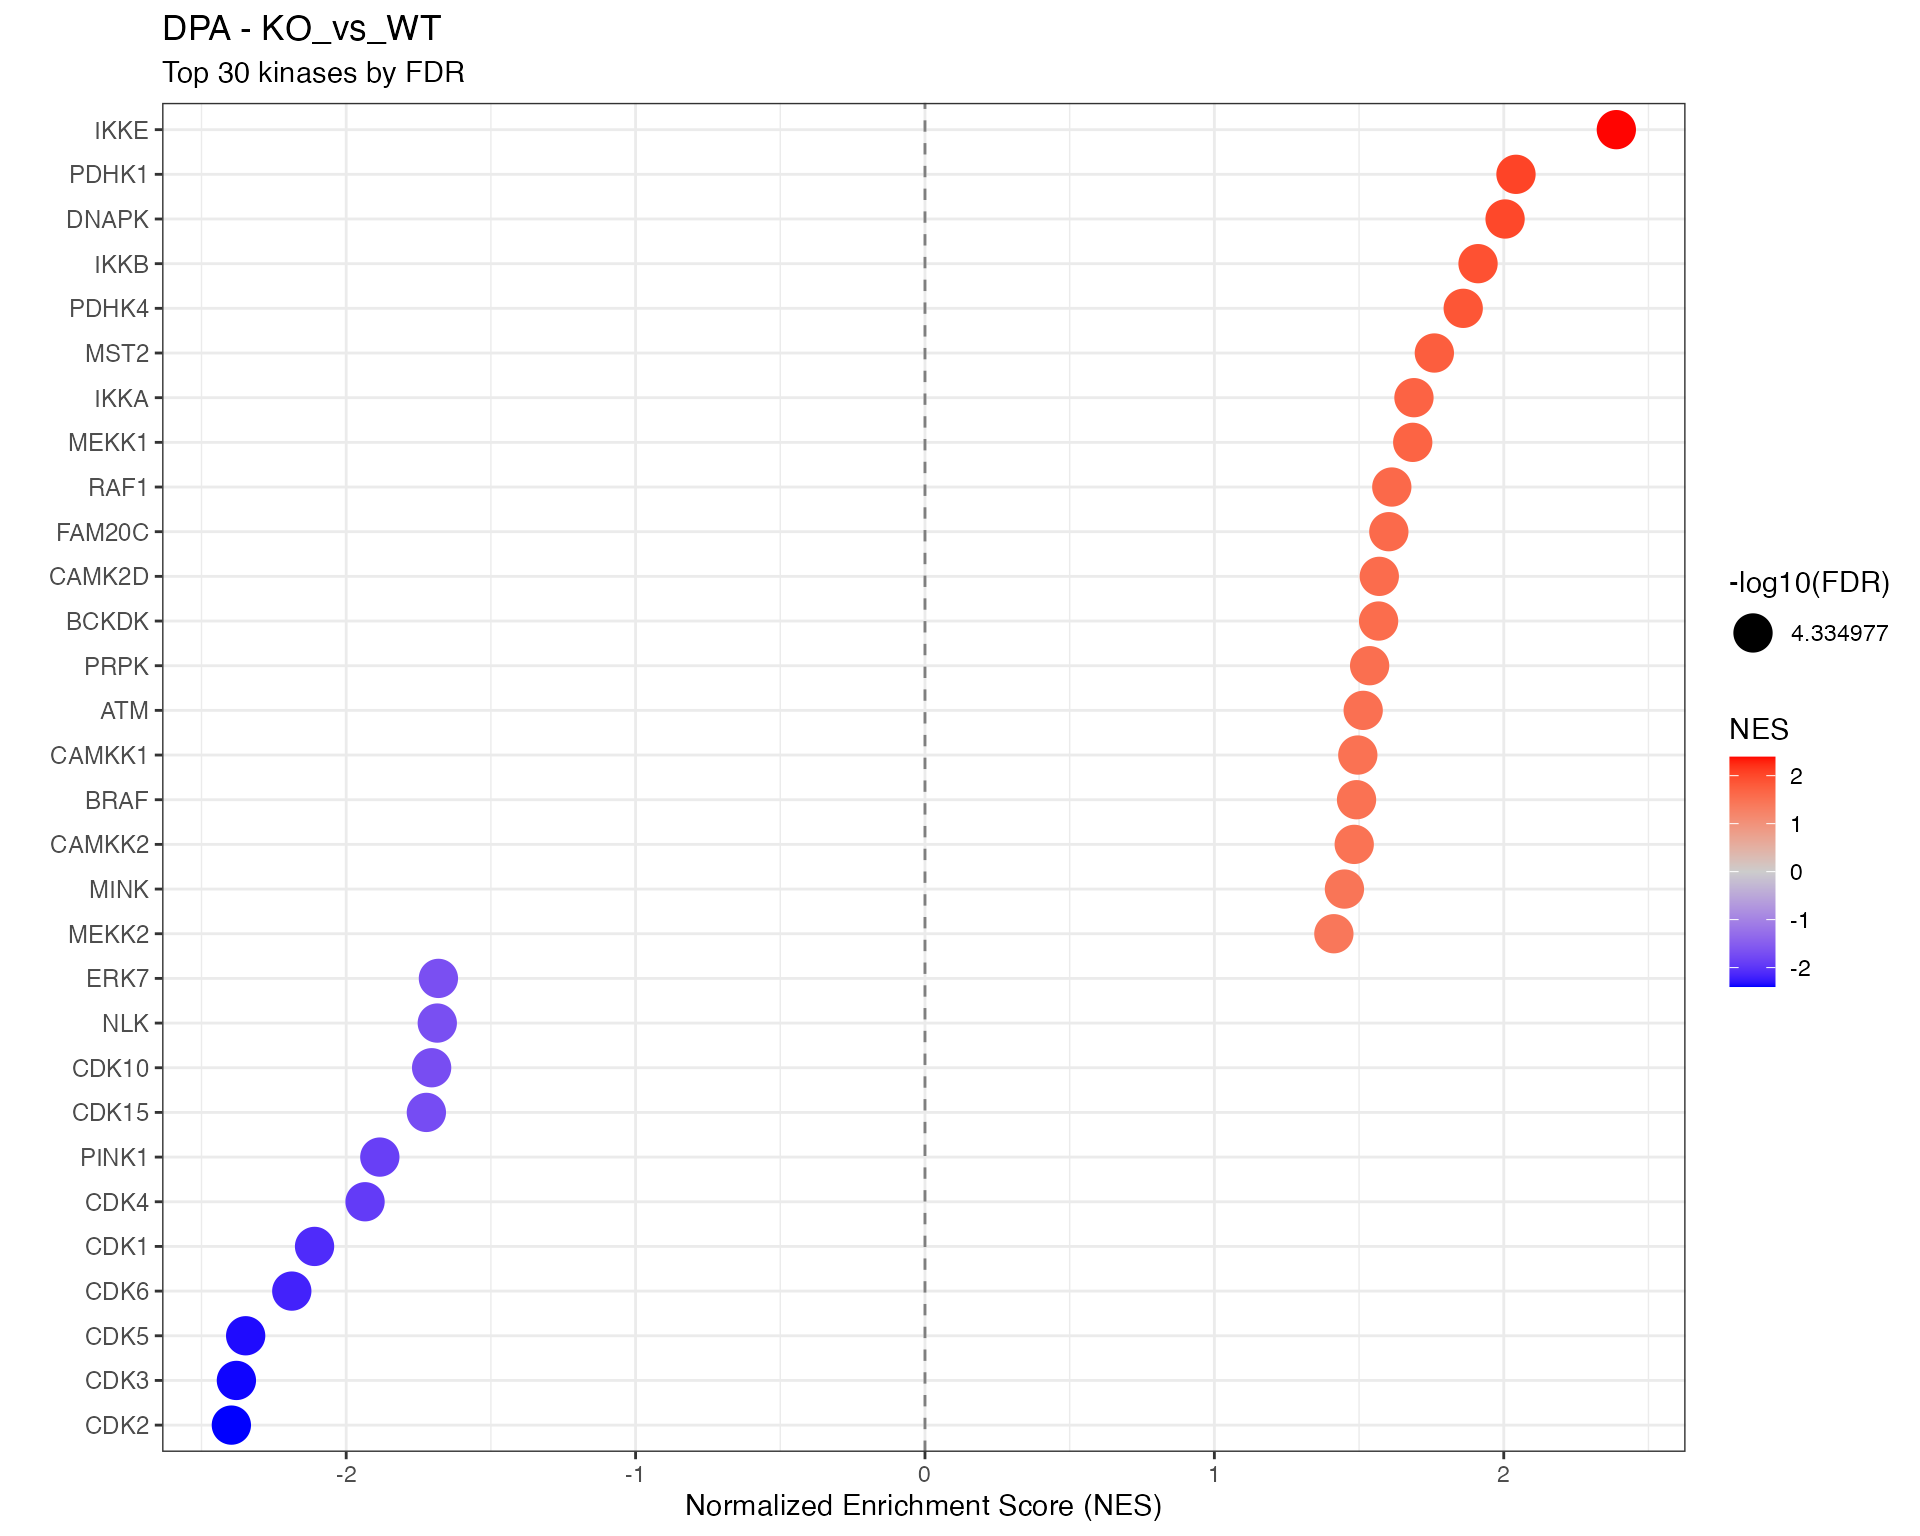
Results by Contrast
for (ctr in unique(mea_clean$contrast)) {
  cat("\n\n## ", ctr, "\n\n")

  ctr_data <- mea_clean |> filter(contrast == ctr)
  n_sig <- sum(ctr_data$FDR < 0.1, na.rm = TRUE)
  cat("**Significant kinases (FDR < 0.1):** ", n_sig, "\n\n")

  # Top kinases dotplot using shared function
  p <- plot_enrichment_dotplot(
    ctr_data,
    item_col = "kinase",
    fdr_col = "FDR",
    title = paste0(params$analysis_type, " - ", ctr),
    subtitle = "Top 30 kinases by FDR"
  )
  print(p)
  cat("\n\n")

  # Significant kinases table
  cat("### Significant Kinases\n\n")
  sig_table <- ctr_data |>
    filter(FDR < 0.1) |>
    select(kinase, NES, pvalue, FDR, n_substrates = size) |>
    arrange(FDR) |>
    mutate(across(where(is.numeric), ~round(.x, 4)))
  print(htmltools::tagList(
    DT::datatable(sig_table,
                  extensions = 'Buttons',
                  options = list(pageLength = 15, scrollX = TRUE,
                                 dom = 'Bfrtip', buttons = c('copy', 'csv', 'excel')))
  ))
  cat("\n\n")
}
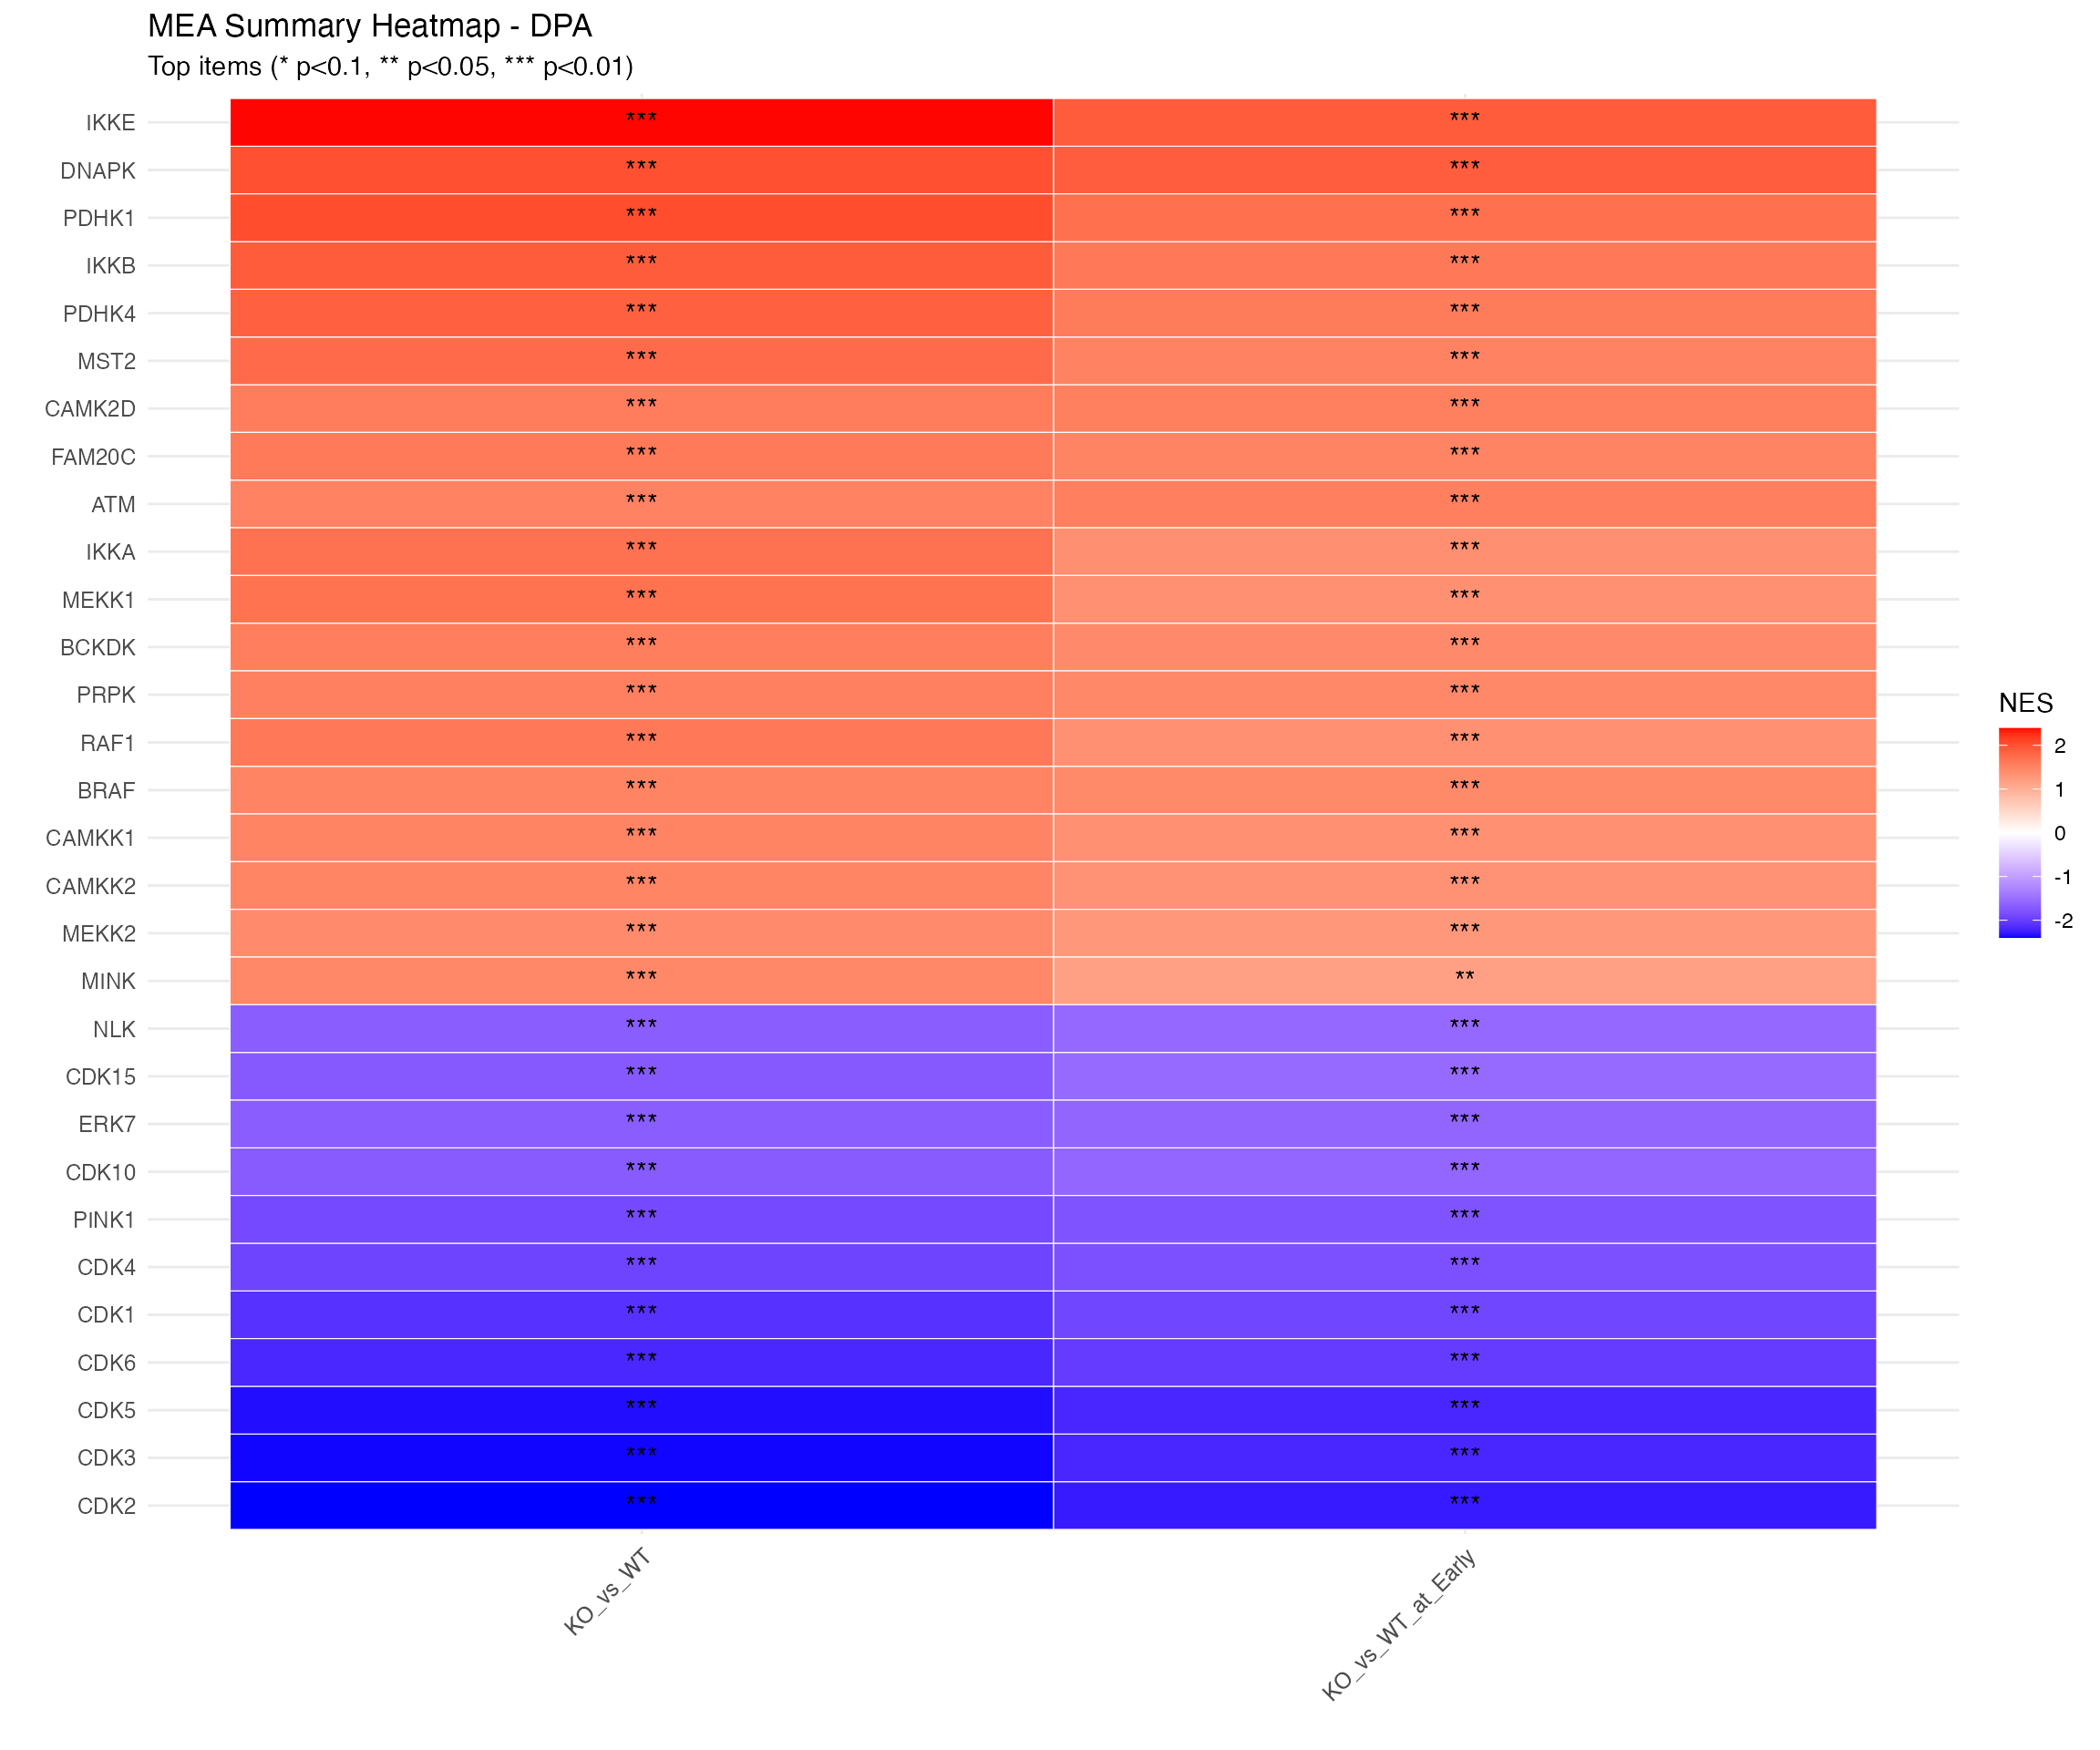
Summary Heatmap
# Using shared heatmap function
plot_enrichment_heatmap(
  mea_clean,
  item_col = "kinase",
  fdr_col = "FDR",
  n_top = 30,
  title = paste0("MEA Summary Heatmap - ", params$analysis_type)
)
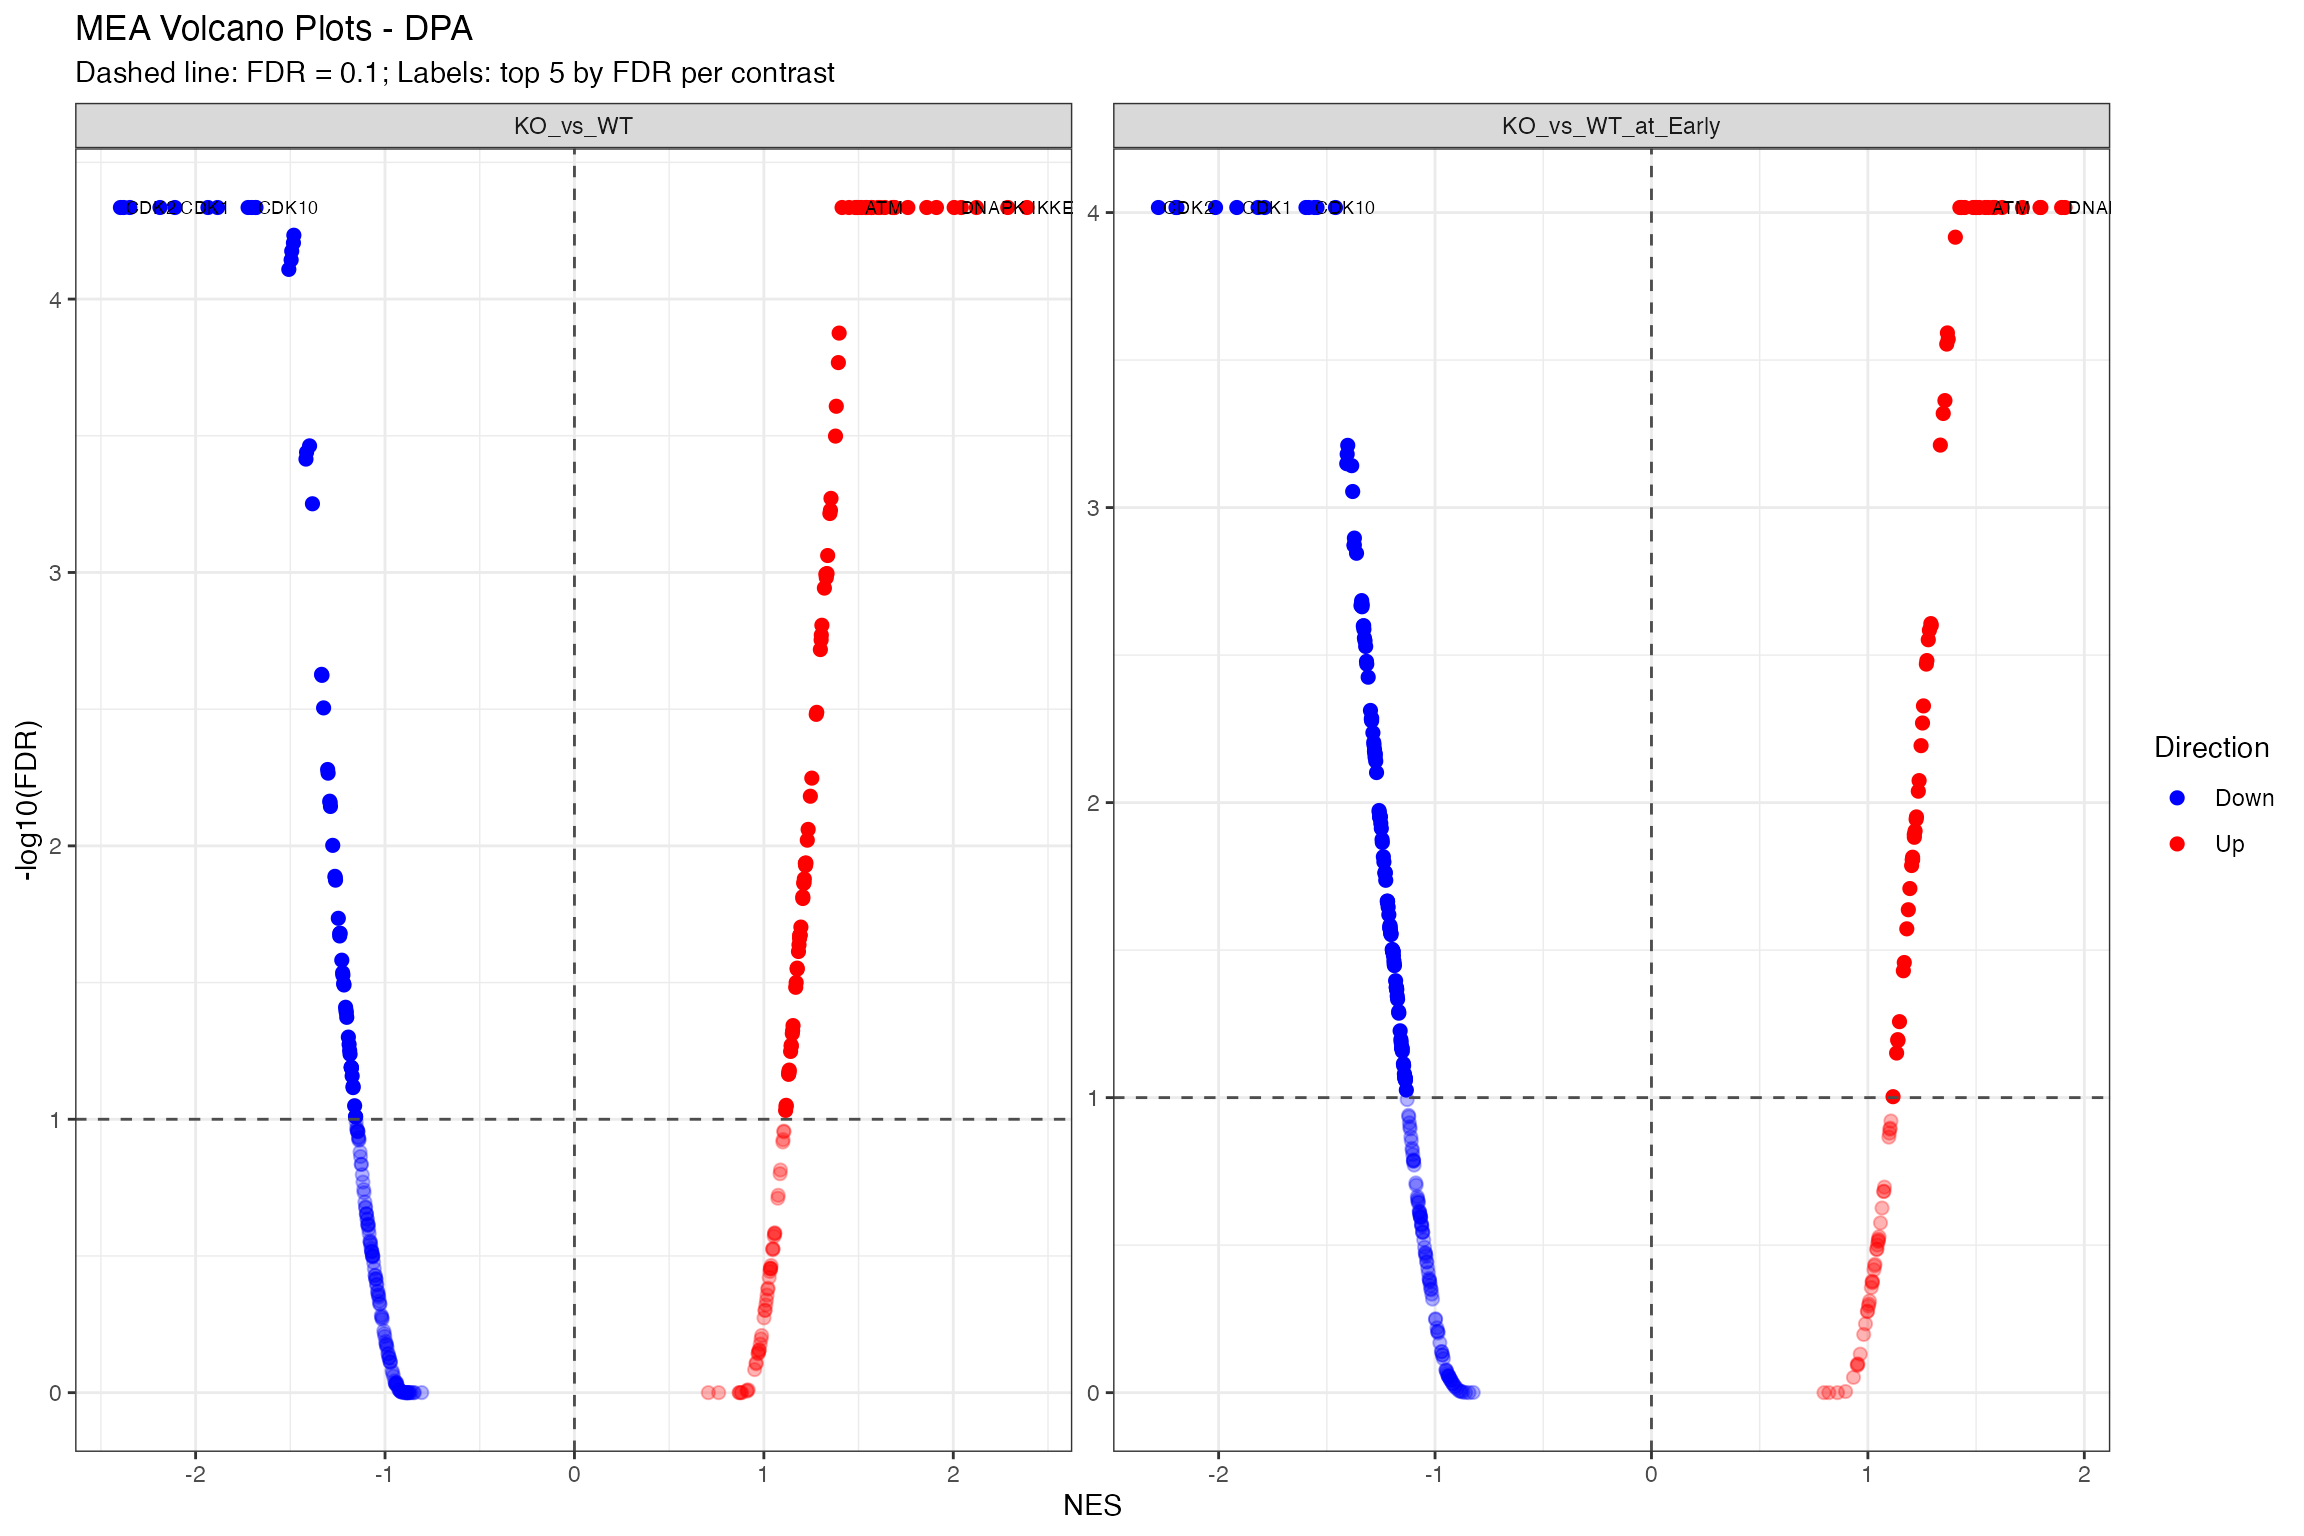
Volcano Plot
# Using shared volcano function
plot_enrichment_volcano(
  mea_clean,
  item_col = "kinase",
  fdr_col = "FDR",
  title = paste0("MEA Volcano Plots - ", params$analysis_type)
)
Diagnostics
pval_diag <- mea_clean |>
  group_by(contrast) |>
  summarise(
    `Min p-value` = signif(min(pvalue, na.rm = TRUE), 3),
    `p < 0.05` = sum(pvalue < 0.05, na.rm = TRUE),
    `p < 0.01` = sum(pvalue < 0.01, na.rm = TRUE),
    Total = n(),
    .groups = "drop"
  ) |>
  rename(Contrast = contrast)
knitr::kable(pval_diag, caption = paste("Raw p-value Distribution -", params$analysis_type))| Contrast | Min p-value | p < 0.05 | p < 0.01 | Total |
|---|---|---|---|---|
| KO_vs_WT | 0.001 | 145 | 102 | 311 |
| KO_vs_WT_at_Early | 0.001 | 174 | 123 | 311 |
All Results
# All kinases across all contrasts
all_results_dt <- mea_clean |>
  select(contrast, kinase, NES, pvalue, FDR, size) |>
  arrange(contrast, FDR) |>
  mutate(across(where(is.numeric), ~round(.x, 4)))

DT::datatable(all_results_dt,
  filter = "top",
  extensions = 'Buttons',
  options = list(pageLength = 15, scrollX = TRUE,
                 dom = 'Bfrtip', buttons = c('copy', 'csv', 'excel')),
  caption = "All kinases across all contrasts")
Export Results
# Export to Excel
export_list <- list(
  all_results = mea_clean |>
    select(contrast, kinase, NES, pvalue, FDR, size) |>
    arrange(contrast, FDR),
  significant = mea_clean |>
    filter(FDR < 0.1) |>
    select(contrast, kinase, NES, pvalue, FDR, size) |>
    arrange(contrast, FDR),
  summary = summary_df
)

xlsx_file <- file.path(output_dir, paste0("MEA_", params$analysis_type, "_results.xlsx"))
writexl::write_xlsx(export_list, xlsx_file)

rds_file <- file.path(output_dir, paste0("MEA_", params$analysis_type, "_results.rds"))
saveRDS(mea_clean, rds_file)

cat("Exported:\n -", xlsx_file, "\n -", rds_file, "\n")
message("Vignette mode: File export skipped.")Session Info
## R version 4.6.1 (2026-06-24)
## Platform: x86_64-pc-linux-gnu
## Running under: Ubuntu 24.04.4 LTS
##
## Matrix products: default
## BLAS:   /usr/lib/x86_64-linux-gnu/openblas-pthread/libblas.so.3
## LAPACK: /usr/lib/x86_64-linux-gnu/openblas-pthread/libopenblasp-r0.3.26.so;  LAPACK version 3.12.0
##
## locale:
##  [1] LC_CTYPE=C.UTF-8       LC_NUMERIC=C           LC_TIME=C.UTF-8
##  [4] LC_COLLATE=C.UTF-8     LC_MONETARY=C.UTF-8    LC_MESSAGES=C.UTF-8
##  [7] LC_PAPER=C.UTF-8       LC_NAME=C              LC_ADDRESS=C
## [10] LC_TELEPHONE=C         LC_MEASUREMENT=C.UTF-8 LC_IDENTIFICATION=C
##
## time zone: UTC
## tzcode source: system (glibc)
##
## attached base packages:
## [1] stats     graphics  grDevices utils     datasets  methods   base
##
## other attached packages:
## [1] prophosqua_0.3.0 writexl_1.5.4    forcats_1.0.1    purrr_1.2.2
## [5] ggplot2_4.0.3    tidyr_1.3.2      DT_0.34.0        dplyr_1.2.1
##
## loaded via a namespace (and not attached):
##  [1] gtable_0.3.6       jsonlite_2.0.0     compiler_4.6.1     tidyselect_1.2.1
##  [5] jquerylib_0.1.4    systemfonts_1.3.2  scales_1.4.0       textshaping_1.0.5
##  [9] yaml_2.3.12        fastmap_1.2.0      R6_2.6.1           labeling_0.4.3
## [13] patchwork_1.3.2    generics_0.1.4     knitr_1.51         htmlwidgets_1.6.4
## [17] tibble_3.3.1       bookdown_0.47      desc_1.4.3         RColorBrewer_1.1-3
## [21] bslib_0.11.0       pillar_1.11.1      rlang_1.3.0        cachem_1.1.0
## [25] xfun_0.60          S7_0.2.2           fs_2.1.0           sass_0.4.10
## [29] otel_0.2.0         cli_3.6.6          withr_3.0.3        pkgdown_2.2.1
## [33] magrittr_2.0.5     crosstalk_1.2.2    digest_0.6.39      grid_4.6.1
## [37] lifecycle_1.0.5    vctrs_0.7.3        evaluate_1.0.5     glue_1.8.1
## [41] farver_2.1.2       ggseqlogo_0.2.2    ragg_1.5.2         rmarkdown_2.31
## [45] tools_4.6.1        pkgconfig_2.0.3    htmltools_0.5.9