Kinase Activity (PTMsigDB + GSEA)
DPA
FGCZ
29 July, 2026
Source:vignettes/Analysis_PTMSEA.Rmd
Analysis_PTMSEA.RmdOverview
PTM-SEA (Post-Translational Modification Signature Enrichment Analysis) for DPA analysis.
PTM-SEA uses flanking sequences and PTMsigDB signatures to infer kinase activities from phosphoproteomics data via ClusterProfiler’s GSEA.
Analysis Type: DPA
- DPA: Differential PTM Abundance - raw phosphosite changes (includes protein abundance effects)
- DPU: Differential PTM Usage - protein-normalized changes (true stoichiometry changes)
- CF: CorrectFirst - alternative protein-correction approach
Load Libraries and Data
library(prophosqua)
library(clusterProfiler)
library(dplyr)
library(DT)
library(enrichplot)
library(fgsea)
library(forcats)
library(purrr)
library(readxl)
library(writexl)
library(ggplot2)
if (pipeline_mode) {
  # Pipeline mode: load from Excel file
  data <- readxl::read_xlsx(params$xlsx_file, sheet = params$sheet)
  output_dir <- if (!is.null(params$output_dir)) params$output_dir else dirname(params$xlsx_file)
} else {
  # Vignette mode: use example data
  data("combined_test_diff_example", package = "prophosqua")
  data <- combined_test_diff_example
  output_dir <- tempdir()
}

data_info <- tibble(
  Property = c("Mode", "Sheet", "Stat Column", "Rows", "Columns", "Contrasts"),
  Value = c(
    if (pipeline_mode) basename(params$xlsx_file) else "Example data",
    params$sheet, params$stat_column,
    nrow(data), ncol(data),
    paste(unique(data$contrast), collapse = ", ")
  )
)
knitr::kable(data_info, caption = "Input Data Summary")| Property | Value |
|---|---|
| Mode | Example data |
| Sheet | combinedSiteProteinData |
| Stat Column | statistic.site |
| Rows | 105824 |
| Columns | 56 |
| Contrasts | KO_vs_WT, KO_vs_WT_at_Early, KO_vs_WT_at_Late, KO_vs_WT_at_Uninfect |
Load PTMsigDB Signatures
# Load PTMsigDB - try multiple sources
ptmsigdb_file <- params$ptmsigdb_file

if (is.null(ptmsigdb_file) || !file.exists(ptmsigdb_file)) {
  # Try bundled resource (compressed)
  bundled_zip <- system.file("extdata", "ptmsigdb_kinase.rds.zip", package = "prophosqua")
  if (file.exists(bundled_zip)) {
    temp_dir <- tempdir()
    unzip(bundled_zip, exdir = temp_dir)
    ptmsigdb_file <- file.path(temp_dir, "ptmsigdb_filtered_KINASE_15mer.rds")
    message("Using bundled PTMsigDB from prophosqua package")
  }
}

if (is.null(ptmsigdb_file) || !file.exists(ptmsigdb_file)) {
  stop("PTMsigDB file not found. Provide via params$ptmsigdb_file or install prophosqua with bundled data.")
}

# Load pathways
if (grepl("\\.rds$", ptmsigdb_file)) {
  pathways <- readRDS(ptmsigdb_file)
  message("Loaded ", length(pathways), " pathways from RDS")
} else {
  pathways <- fgsea::gmtPathways(ptmsigdb_file)
  message("Loaded ", length(pathways), " pathways from GMT")
}

# Count categories
n_kinase <- sum(grepl("^KINASE-", names(pathways)))
n_path <- sum(grepl("^PATH-", names(pathways)))

# Summary table
ptmsigdb_summary <- tibble(
  Property = c("Source File", "Total Signatures", "KINASE signatures", "PATH signatures", "Unique site IDs"),
  Value = c(
    basename(ptmsigdb_file), length(pathways), n_kinase, n_path,
    length(unique(gsub(";[ud]$", "", unlist(pathways))))
  )
)
knitr::kable(ptmsigdb_summary, caption = "PTMsigDB Signature Database Summary")| Property | Value |
|---|---|
| Source File | ptmsigdb_filtered_KINASE_15mer.rds |
| Total Signatures | 662 |
| KINASE signatures | 662 |
| PATH signatures | 0 |
| Unique site IDs | 16279 |
Overlap Statistics
# Our data: unique flanking sequences (trimmed to match pathways)
our_sequences <- data |>
  pull(SequenceWindow) |>
  trimws() |>
  toupper() |>
  unique()
our_sequences_trimmed <- our_sequences |>
  map_chr(~ prophosqua:::trim_flanking_seq(.x, trim_to = params$trim_to))
our_site_ids <- paste0(our_sequences_trimmed, "-p")
n_our_sites <- n_distinct(our_site_ids)

# PTMsigDB: unique site IDs (strip ;u/;d for comparison)
ptmsigdb_ids_raw <- pathways |>
  unlist() |>
  unique()
ptmsigdb_ids_stripped <- ptmsigdb_ids_raw |>
  gsub(";[ud]$", "", x = _) |>
  unique()
n_ptmsigdb_sites <- length(ptmsigdb_ids_stripped)

# Overlap
overlap_ids <- intersect(unique(our_site_ids), ptmsigdb_ids_stripped)
n_overlap <- length(overlap_ids)

overlap_stats <- tibble(
  Metric = c(
    "Our data (unique sequences)", "PTMsigDB (unique site IDs)", "Overlap",
    "% of our sites in PTMsigDB", "% of PTMsigDB sites in our data"
  ),
  Value = c(
    n_our_sites, n_ptmsigdb_sites, n_overlap,
    round(100 * n_overlap / n_our_sites, 2),
    round(100 * n_overlap / n_ptmsigdb_sites, 2)
  )
)
knitr::kable(overlap_stats, caption = paste0("Overlap Statistics (", params$trim_to, "-mer)"))| Metric | Value |
|---|---|
| Our data (unique sequences) | 21683.00 |
| PTMsigDB (unique site IDs) | 16279.00 |
| Overlap | 1151.00 |
| % of our sites in PTMsigDB | 5.31 |
| % of PTMsigDB sites in our data | 7.07 |
Prepare Rank Data
# Prepare ranks using prophosqua (trim_to must match pathways)
prep <- ptmsea_data_prep(
  data = data,
  stat_column = params$stat_column,
  seq_window_col = "SequenceWindow",
  contrast_col = "contrast",
  trim_to = as.character(params$trim_to)
)

prep_info <- tibble(
  Contrast = names(prep$ranks),
  Sites = map_int(prep$ranks, length)
)
knitr::kable(prep_info, caption = paste(params$analysis_type, "Contrasts Prepared"))| Contrast | Sites |
|---|---|
| KO_vs_WT | 21682 |
| KO_vs_WT_at_Early | 21682 |
| KO_vs_WT_at_Late | 21682 |
| KO_vs_WT_at_Uninfect | 21682 |
# Count dropped sequences (handle empty lists/NULL values)
n_dropped <- 0
if (length(prep$dropped) > 0) {
  n_dropped <- sum(map_int(prep$dropped, ~ {
    if (is.null(.x) || length(.x) == 0) {
      return(0L)
    }
    if (is.data.frame(.x)) {
      return(nrow(.x))
    }
    return(length(.x))
  }))
}

if (n_dropped > 0) {
  message("Note: ", n_dropped, " duplicate sequences were dropped.")
}
Run PTM-SEA (GSEA)
results <- run_ptmsea(
  ranks_list = prep$ranks,
  pathways = pathways,
  min_size = params$min_size,
  max_size = params$max_size,
  n_perm = params$n_perm,
  pvalueCutoff = 0.25  # Relaxed for visualization; filter later
)

results_info <- tibble(
  Contrast = names(results),
  `Total Pathways` = map_int(results, ~ nrow(.x@result)),
  `FDR < 0.1` = map_int(results, ~ sum(.x@result$p.adjust < 0.1, na.rm = TRUE)),
  `FDR < 0.05` = map_int(results, ~ sum(.x@result$p.adjust < 0.05, na.rm = TRUE))
)
knitr::kable(results_info, caption = paste(params$analysis_type, "PTM-SEA Results Summary"))| Contrast | Total Pathways | FDR < 0.1 | FDR < 0.05 |
|---|---|---|---|
| KO_vs_WT | 229 | 0 | 0 |
| KO_vs_WT_at_Early | 234 | 3 | 0 |
| KO_vs_WT_at_Late | 230 | 0 | 0 |
| KO_vs_WT_at_Uninfect | 198 | 0 | 0 |
has_ptmsea_results <- sum(results_info$`Total Pathways`) > 0
cat("\n\n# No PTM-SEA Results\n\n")
cat("No pathways passed the size filter (min_size=10). This typically means too few\n")
cat("phosphosites in the input data overlap with PTMsigDB signatures.\n\n")
cat("**Overlap was:", n_overlap, "sites out of", n_our_sites, "**\n\n")
cat("Consider using a larger dataset or lowering `min_size`.\n\n")
Results by Contrast
# Extract all results into data frame using shared function
all_clean <- extract_gsea_results(results) |>
mutate(
pathway = ID,
pathway_short = gsub("^(KINASE|PERT|PATH|DISEASE)-PSP_", "", ID) |>
substr(1, 40)
)
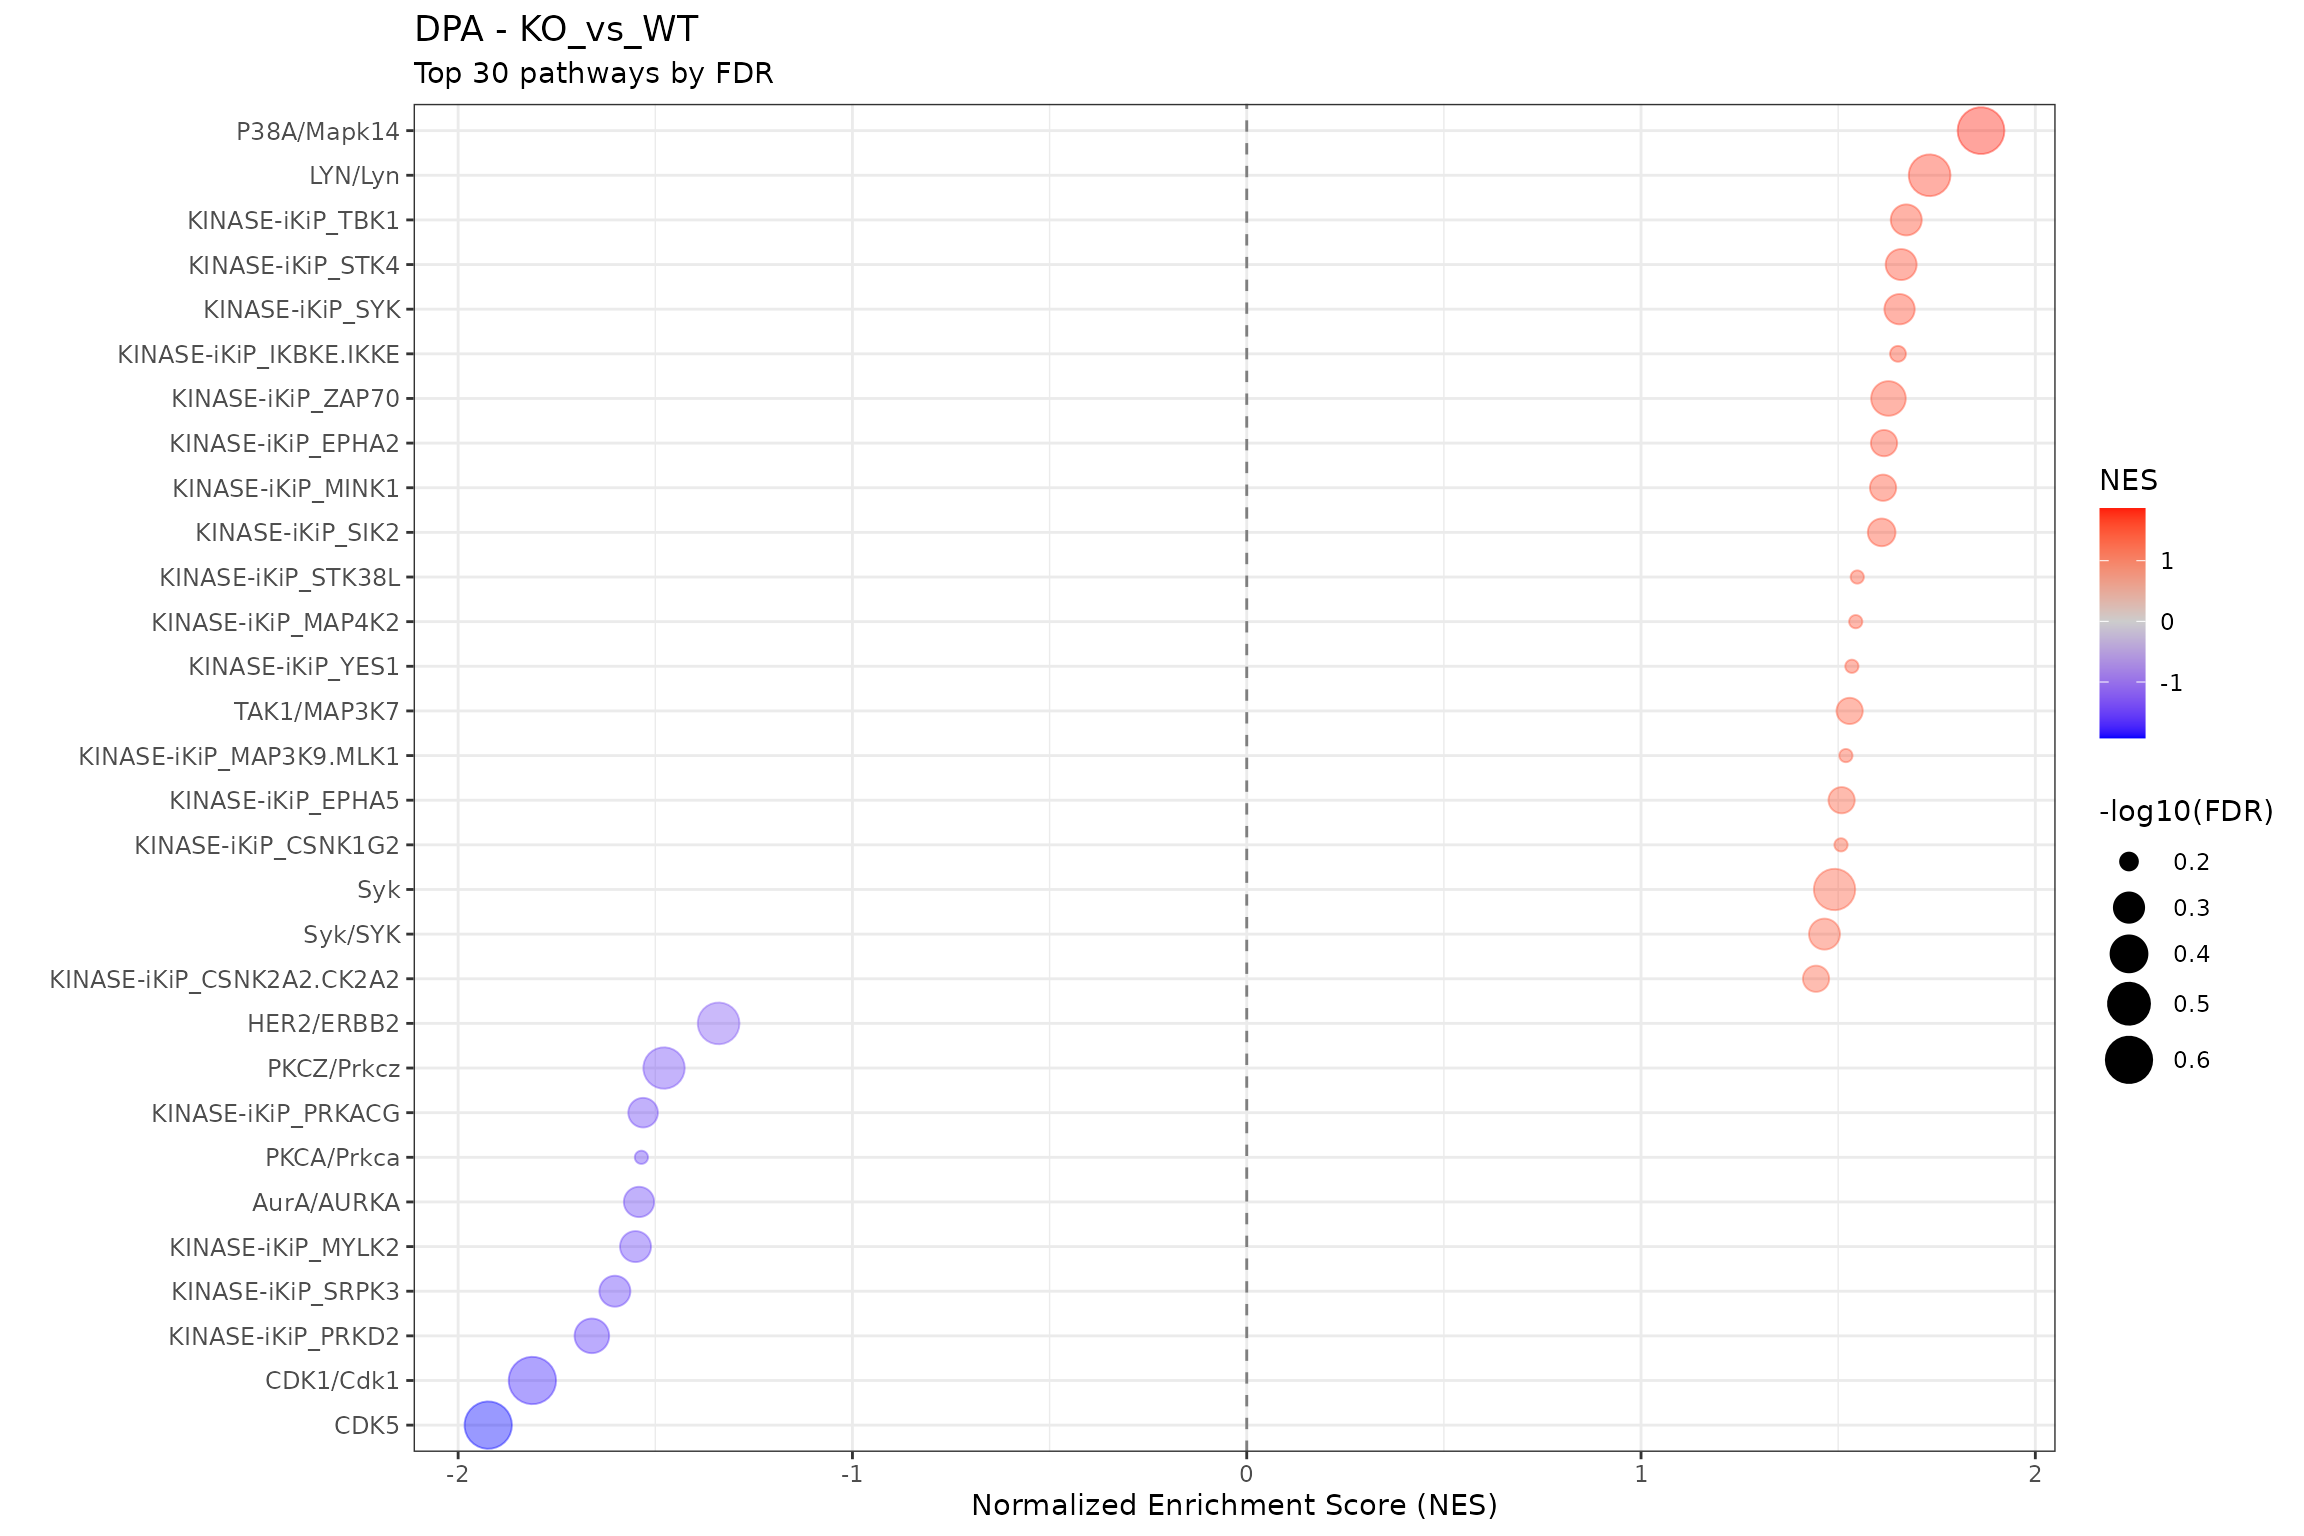
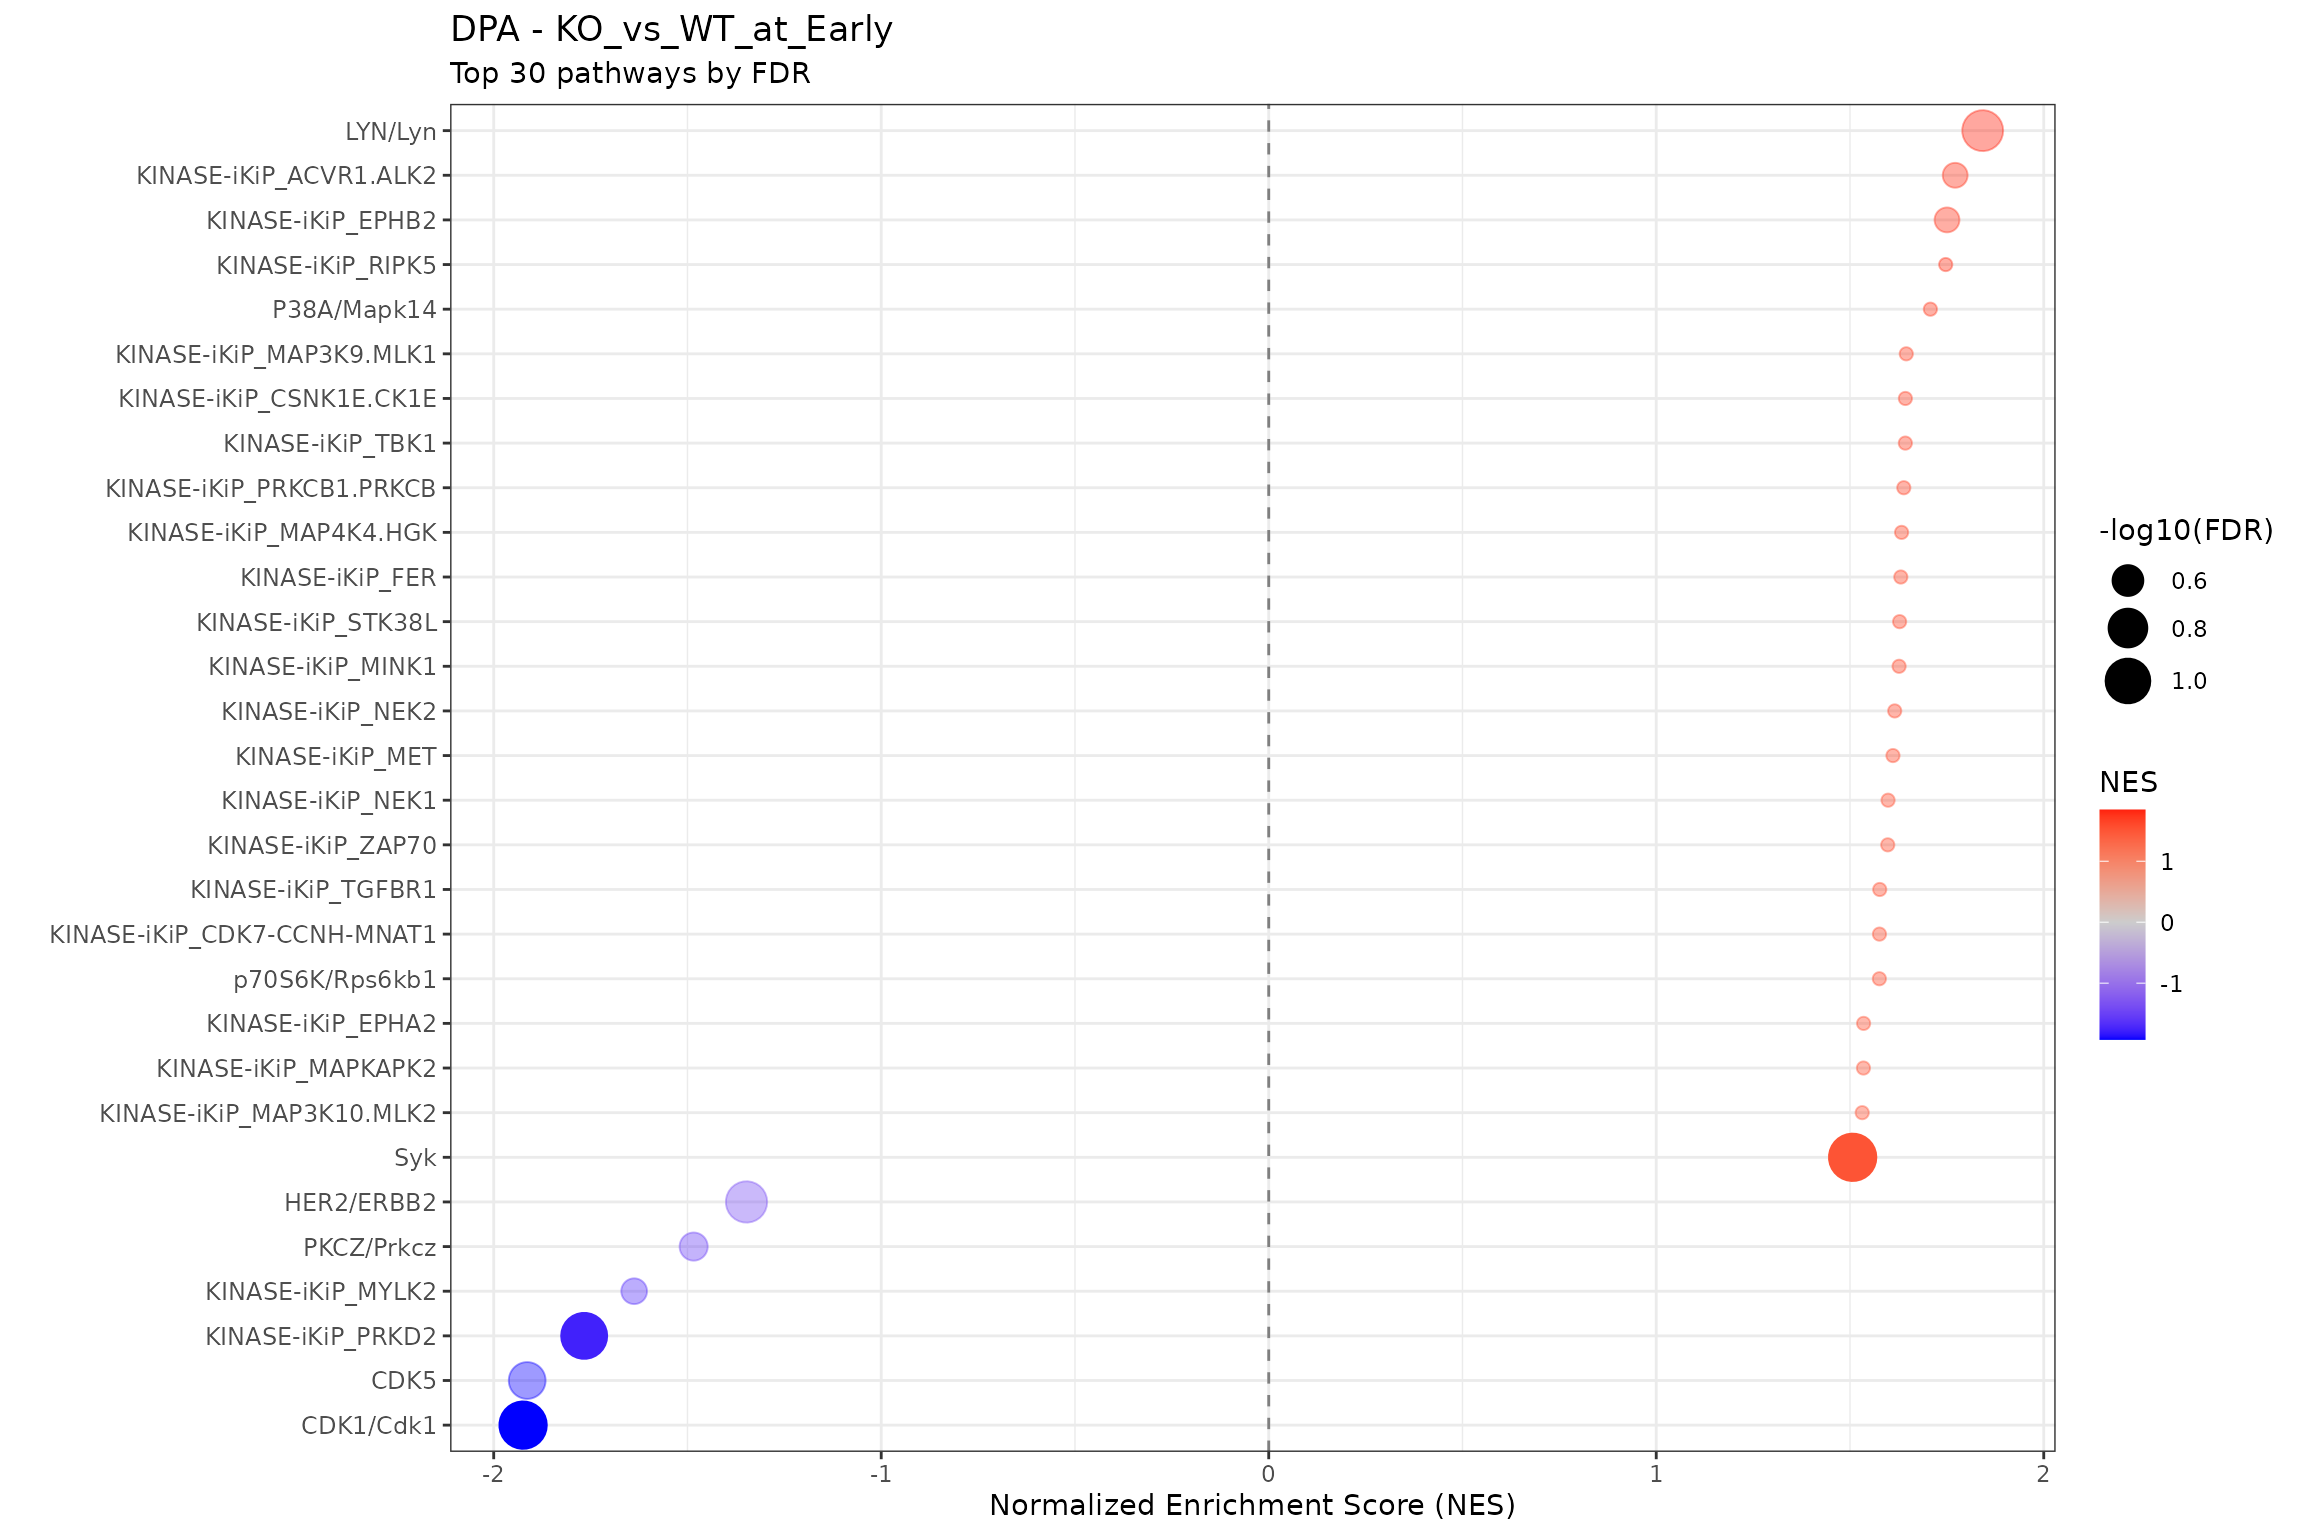
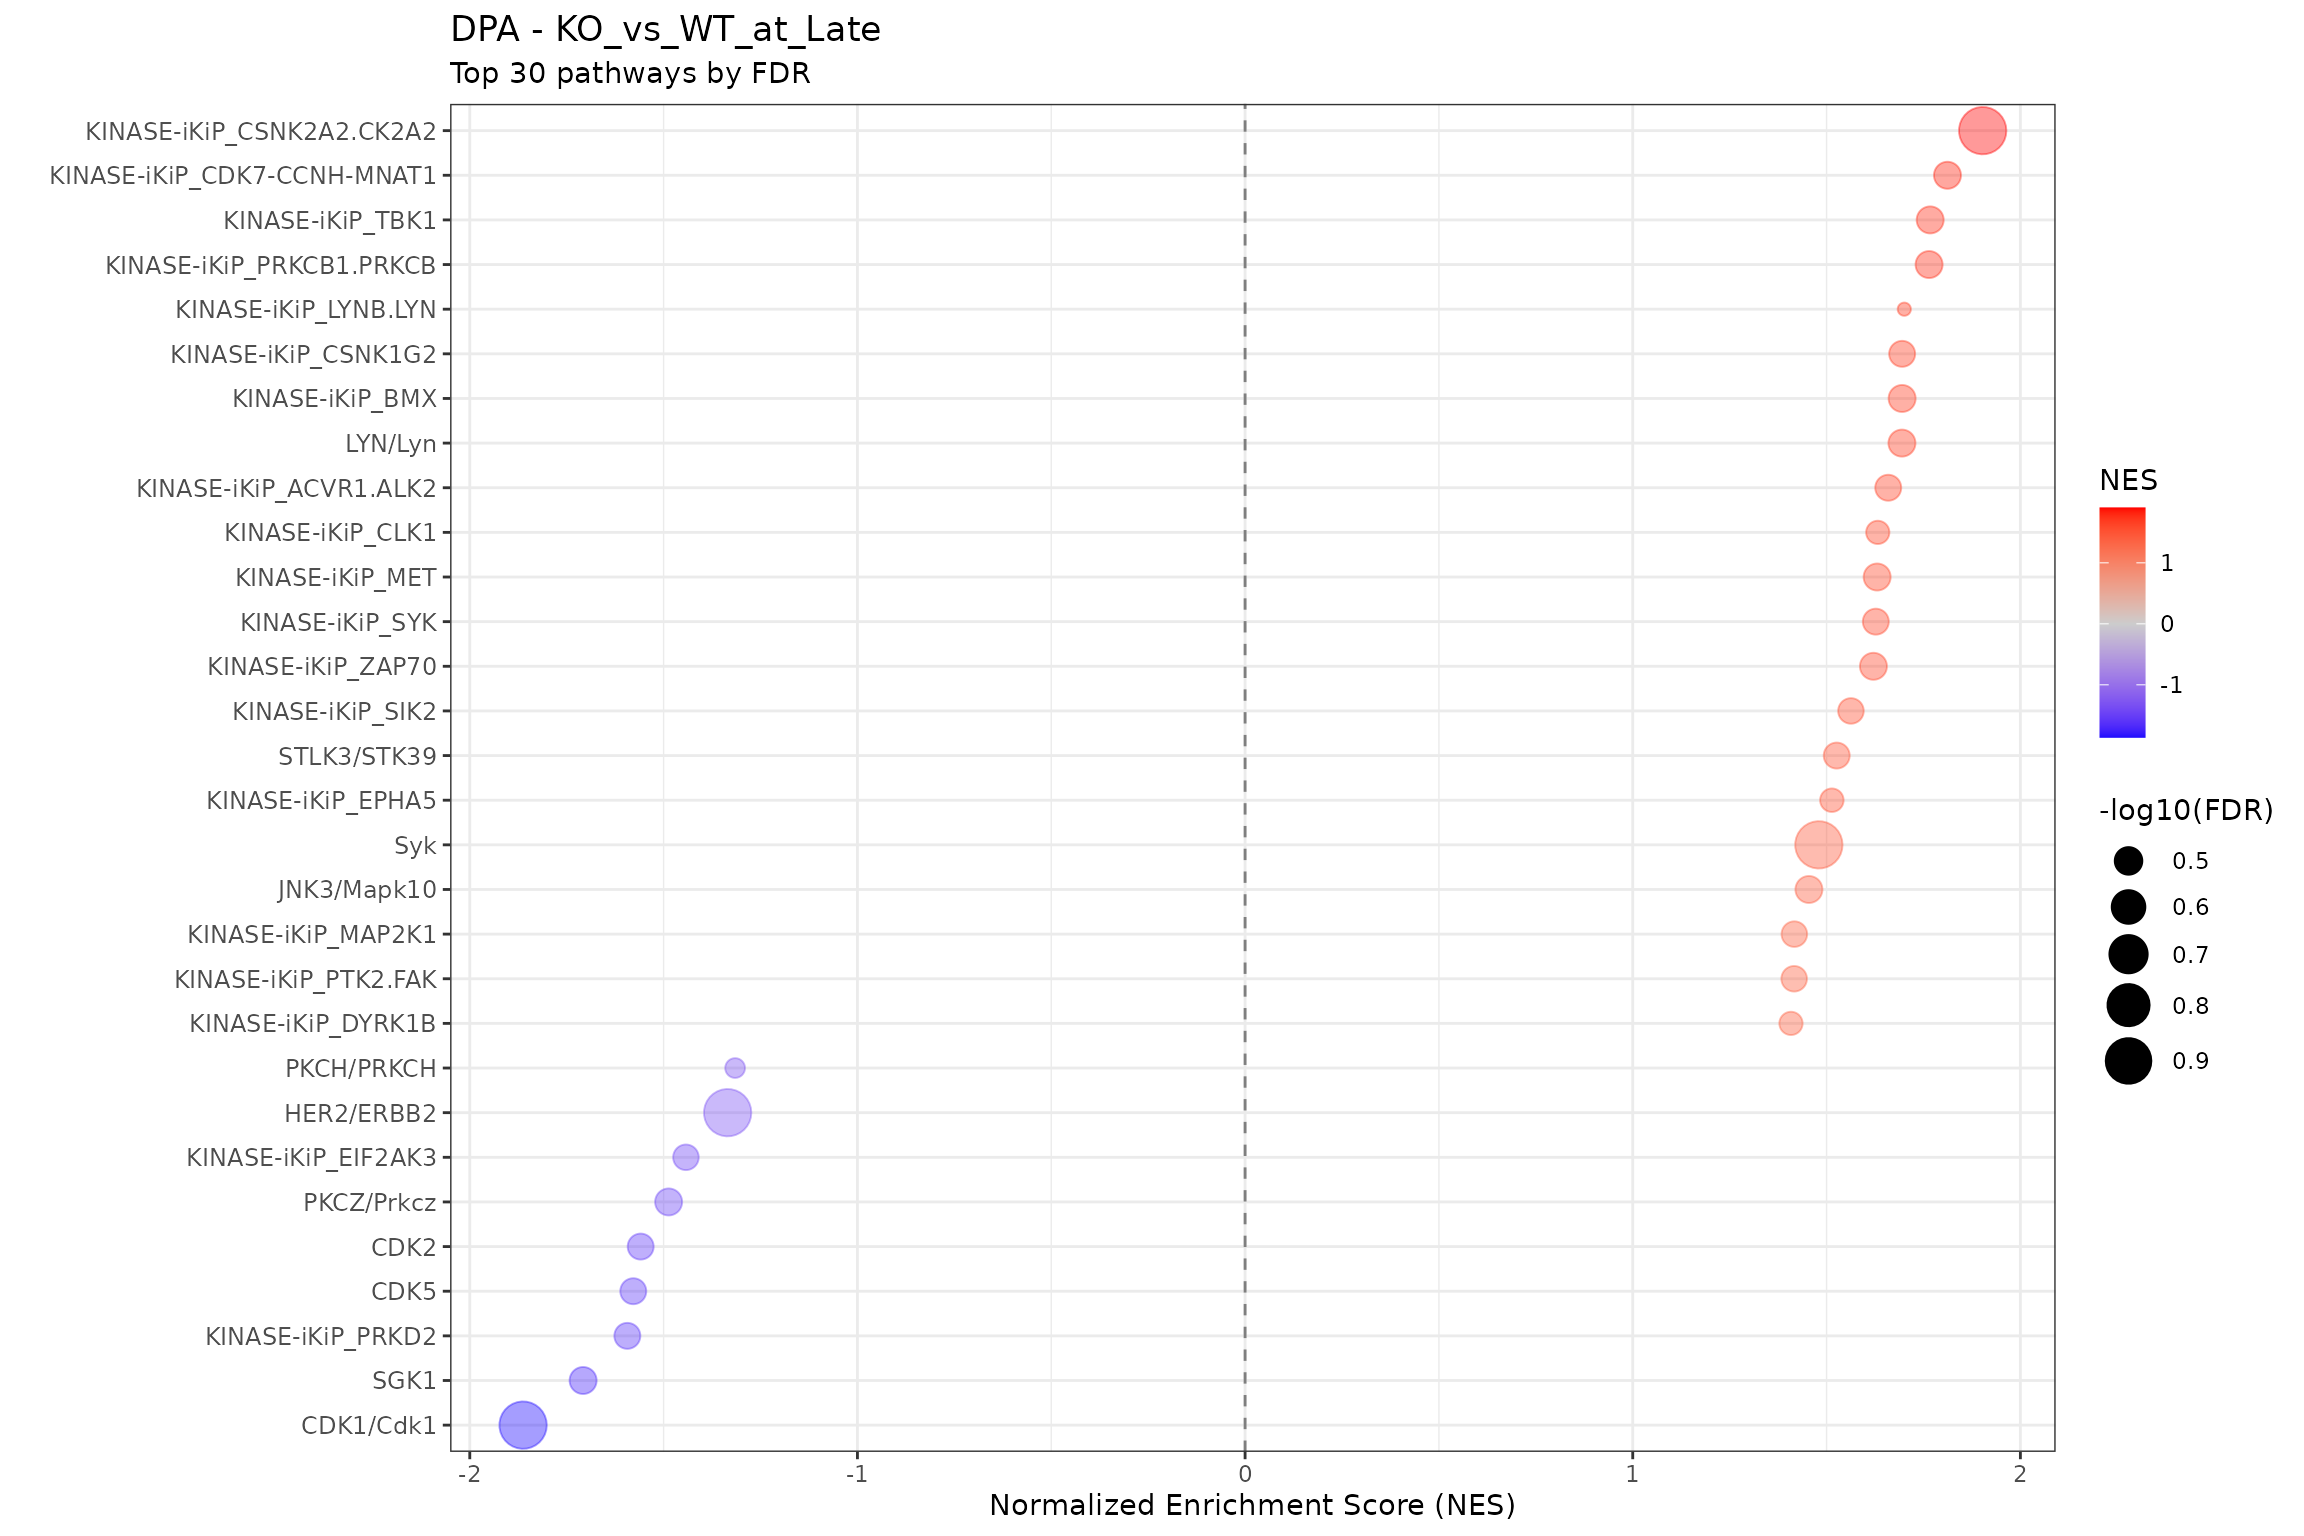
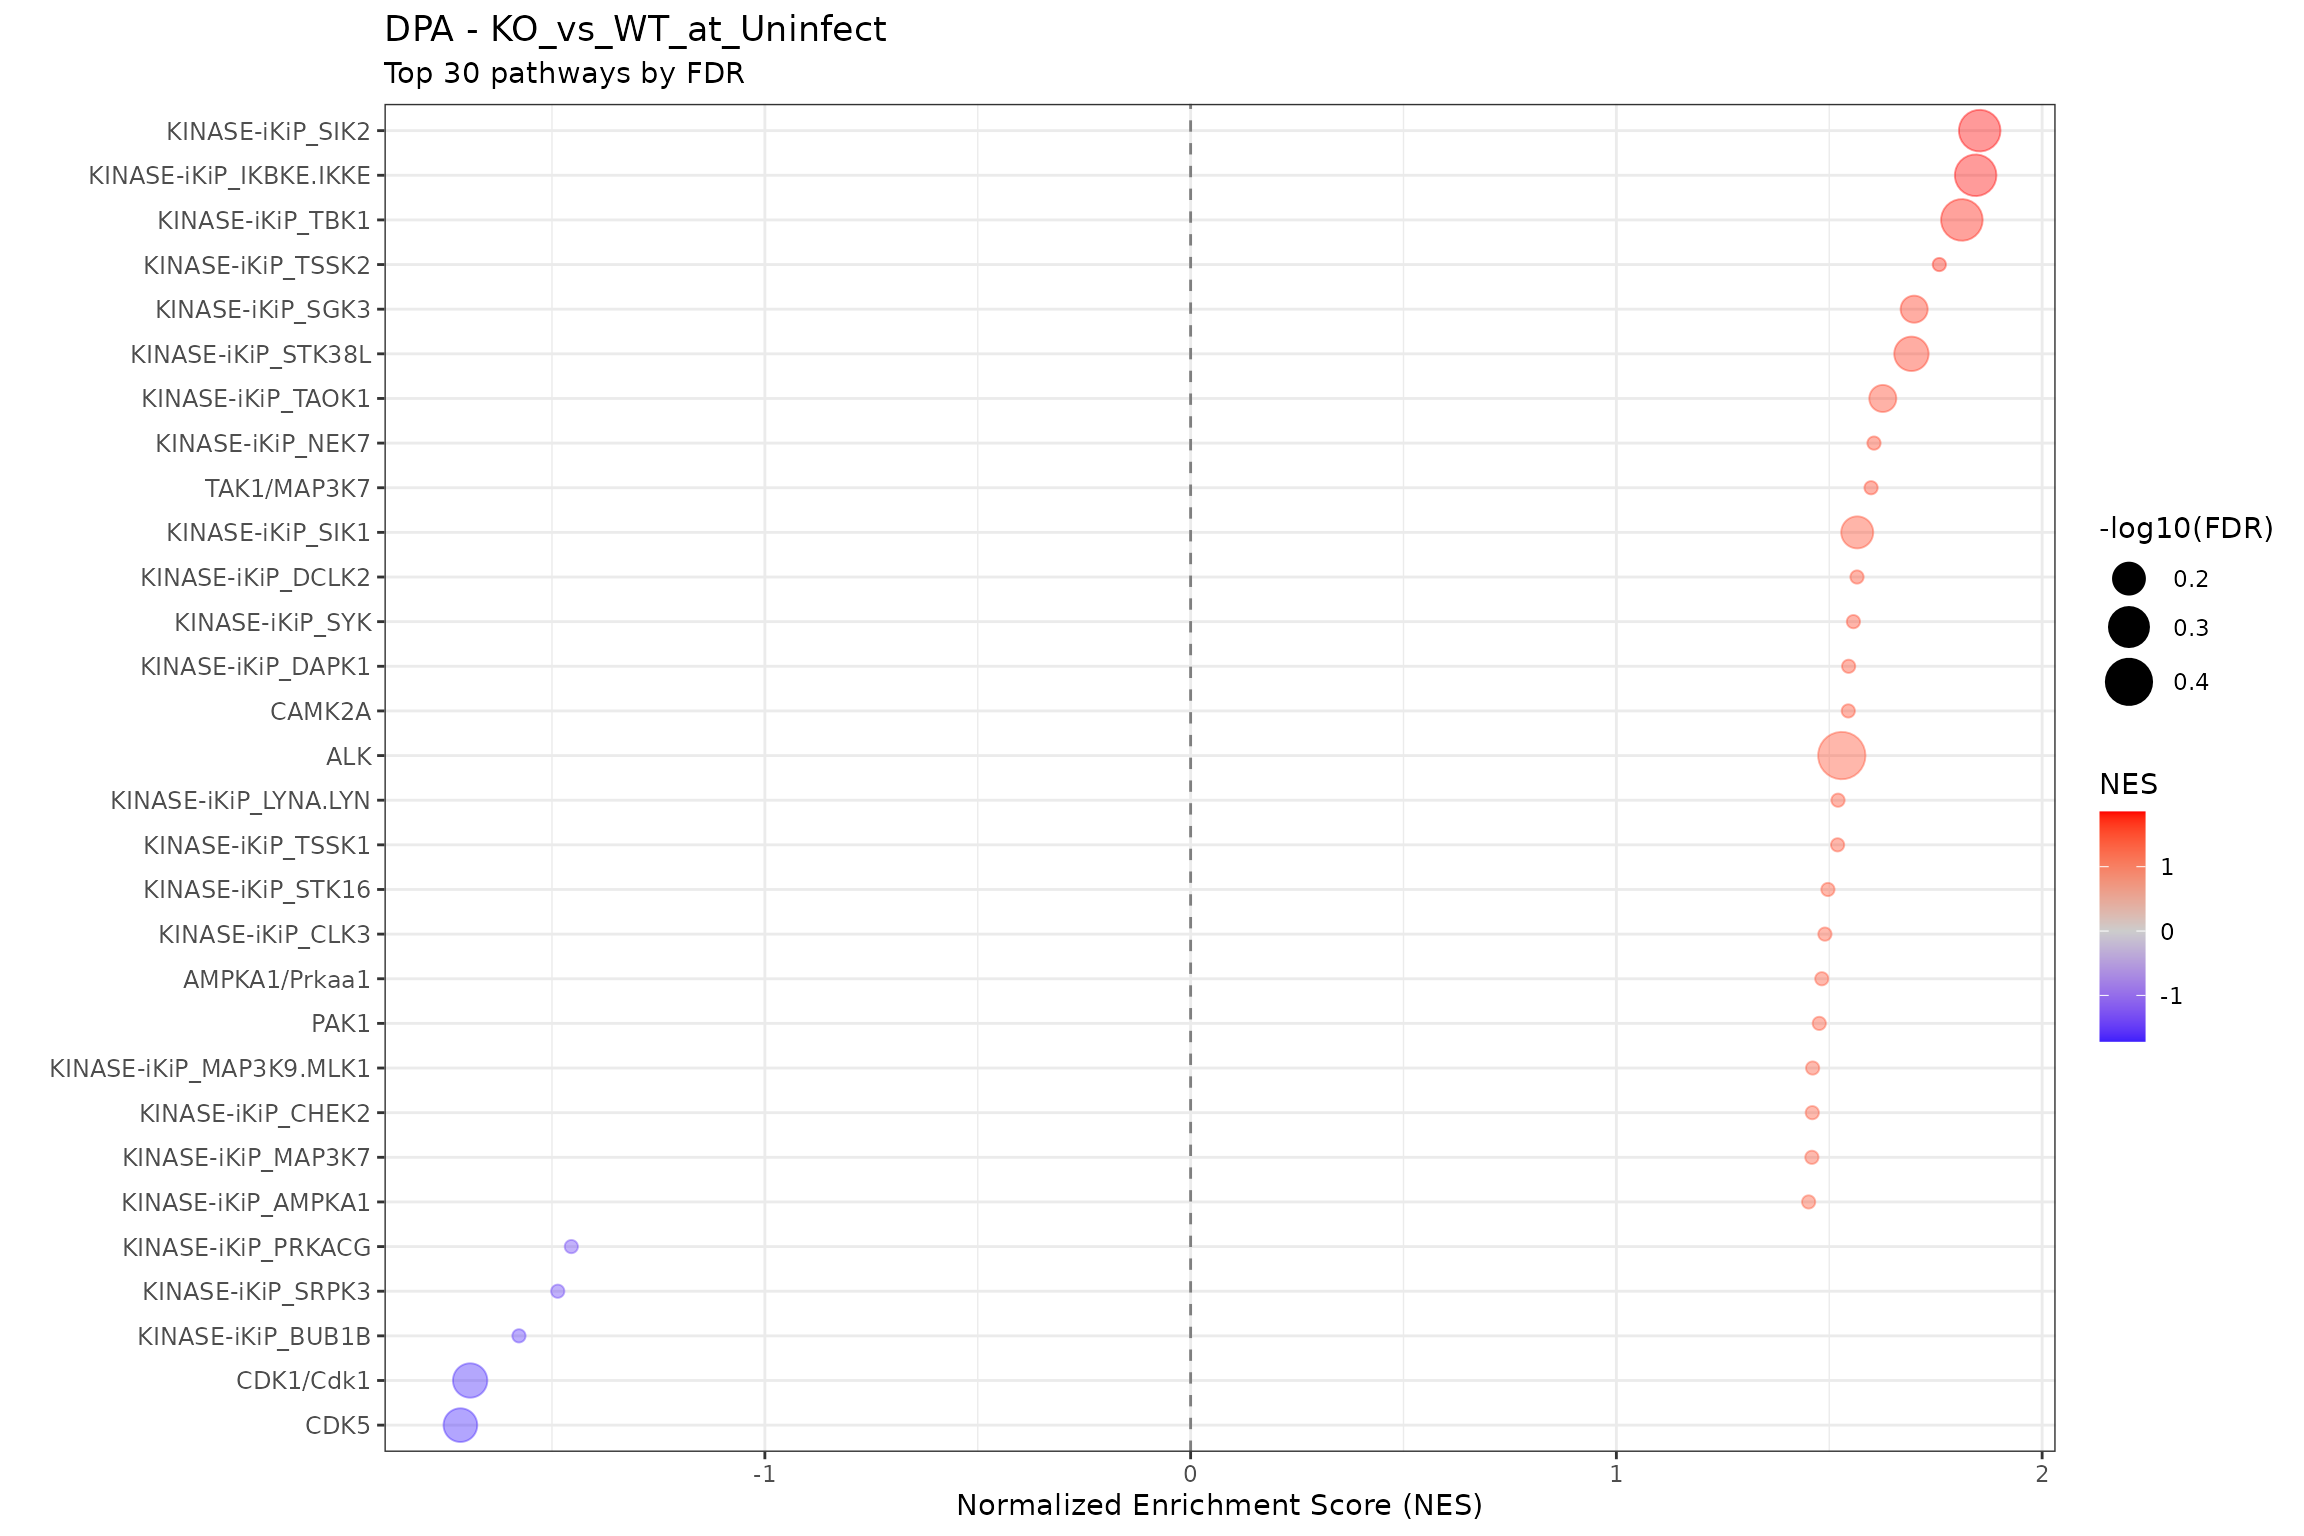
for (ctr in unique(all_clean$contrast)) {
cat("\n\n## ", ctr, "\n\n")
ctr_data <- all_clean |> filter(contrast == ctr)
n_sig <- sum(ctr_data$p.adjust < 0.1, na.rm = TRUE)
cat("**Significant pathways (FDR < 0.1):** ", n_sig, "\n\n")
# Using shared dotplot function
# Check if data exists to avoid empty plot errors
if (nrow(ctr_data) > 0) {
p <- plot_enrichment_dotplot(
ctr_data,
item_col = "pathway_short",
fdr_col = "p.adjust",
title = paste0(params$analysis_type, " - ", ctr),
subtitle = "Top 30 pathways by FDR"
)
print(p)
} else {
cat("No results to plot for this contrast.\n")
}
cat("\n\n")
# Significant pathways table
cat("### Significant Pathways\n\n")
sig_table <- ctr_data |>
filter(p.adjust < 0.1) |>
select(pathway_short, NES, pvalue, FDR = p.adjust, setSize) |>
arrange(FDR) |>
mutate(across(where(is.numeric), ~ round(.x, 4)))
if (nrow(sig_table) > 0) {
print(htmltools::tagList(
DT::datatable(sig_table,
extensions = "Buttons",
options = list(
pageLength = 15, scrollX = TRUE,
dom = "Bfrtip", buttons = c("copy", "csv", "excel")
)
)
))
} else {
cat("No significant pathways found (FDR < 0.1).\n")
}
cat("\n\n")
}
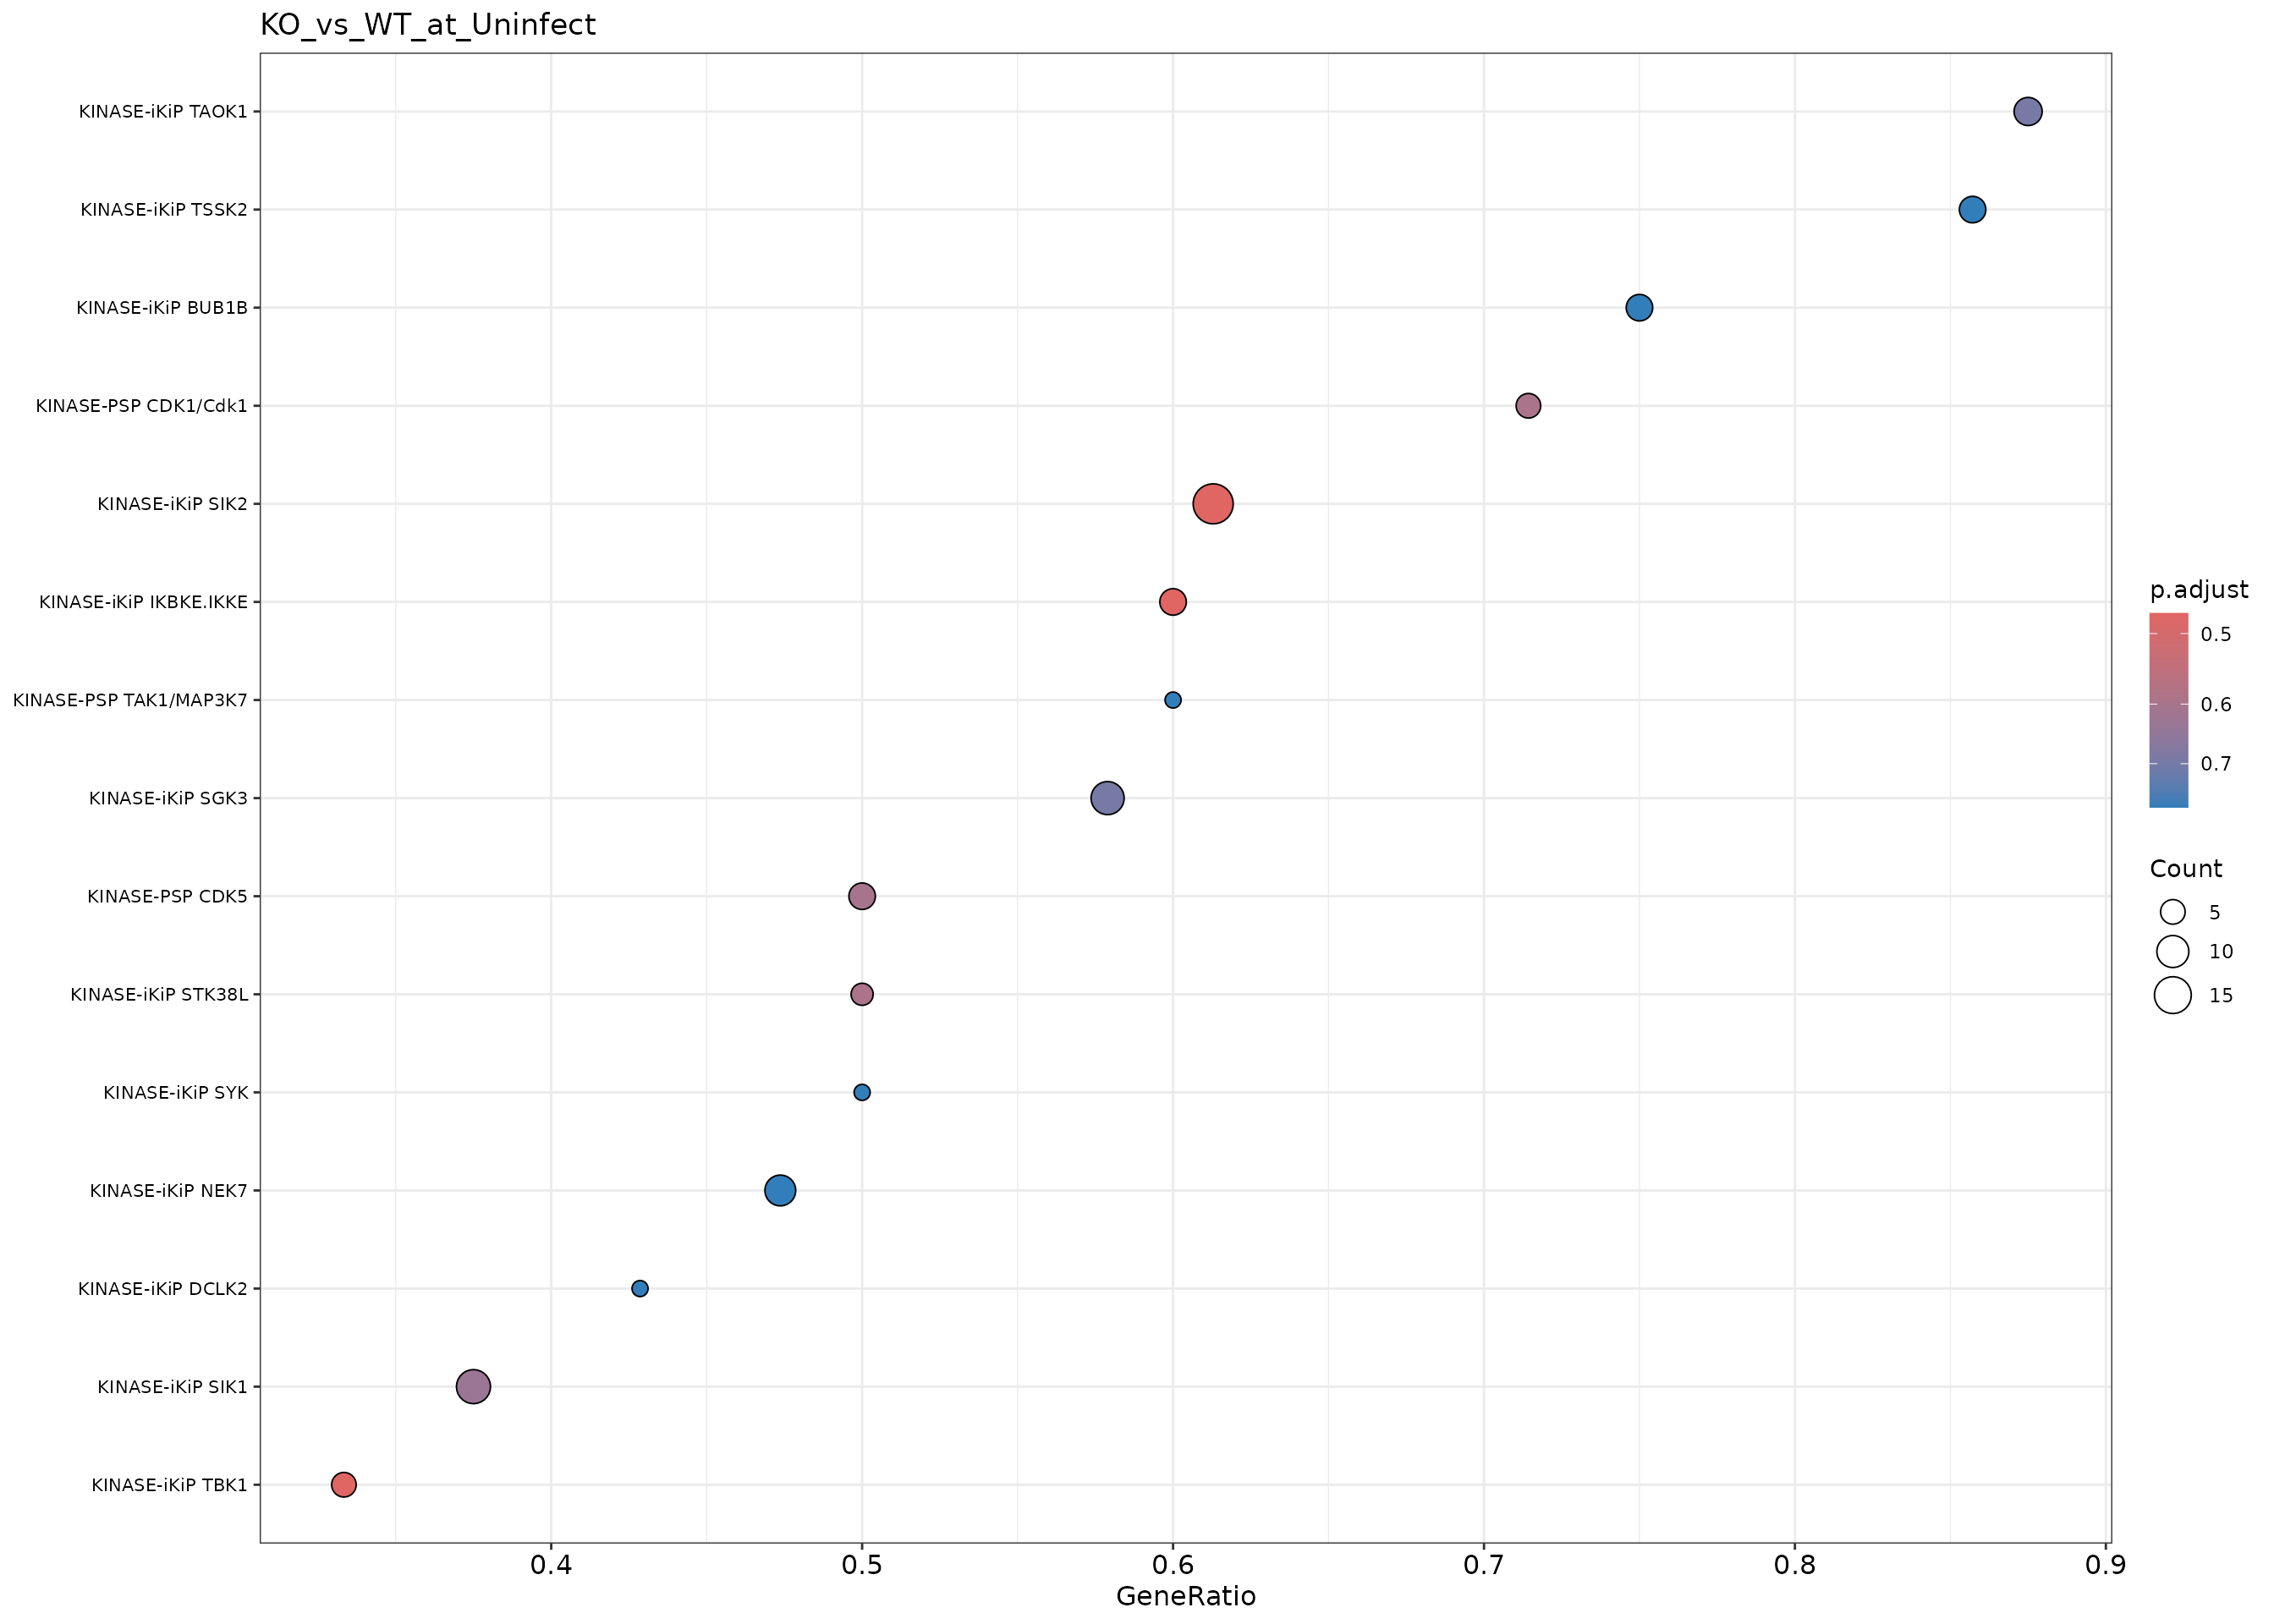
clusterProfiler Dotplots
Combined Dotplot
merged_results <- merge_result(results)
dotplot(merged_results,
  showCategory = 15,
  title = paste(params$analysis_type, "PTM-SEA (All Contrasts)")
) +
  theme(axis.text.x = element_text(angle = 45, hjust = 1))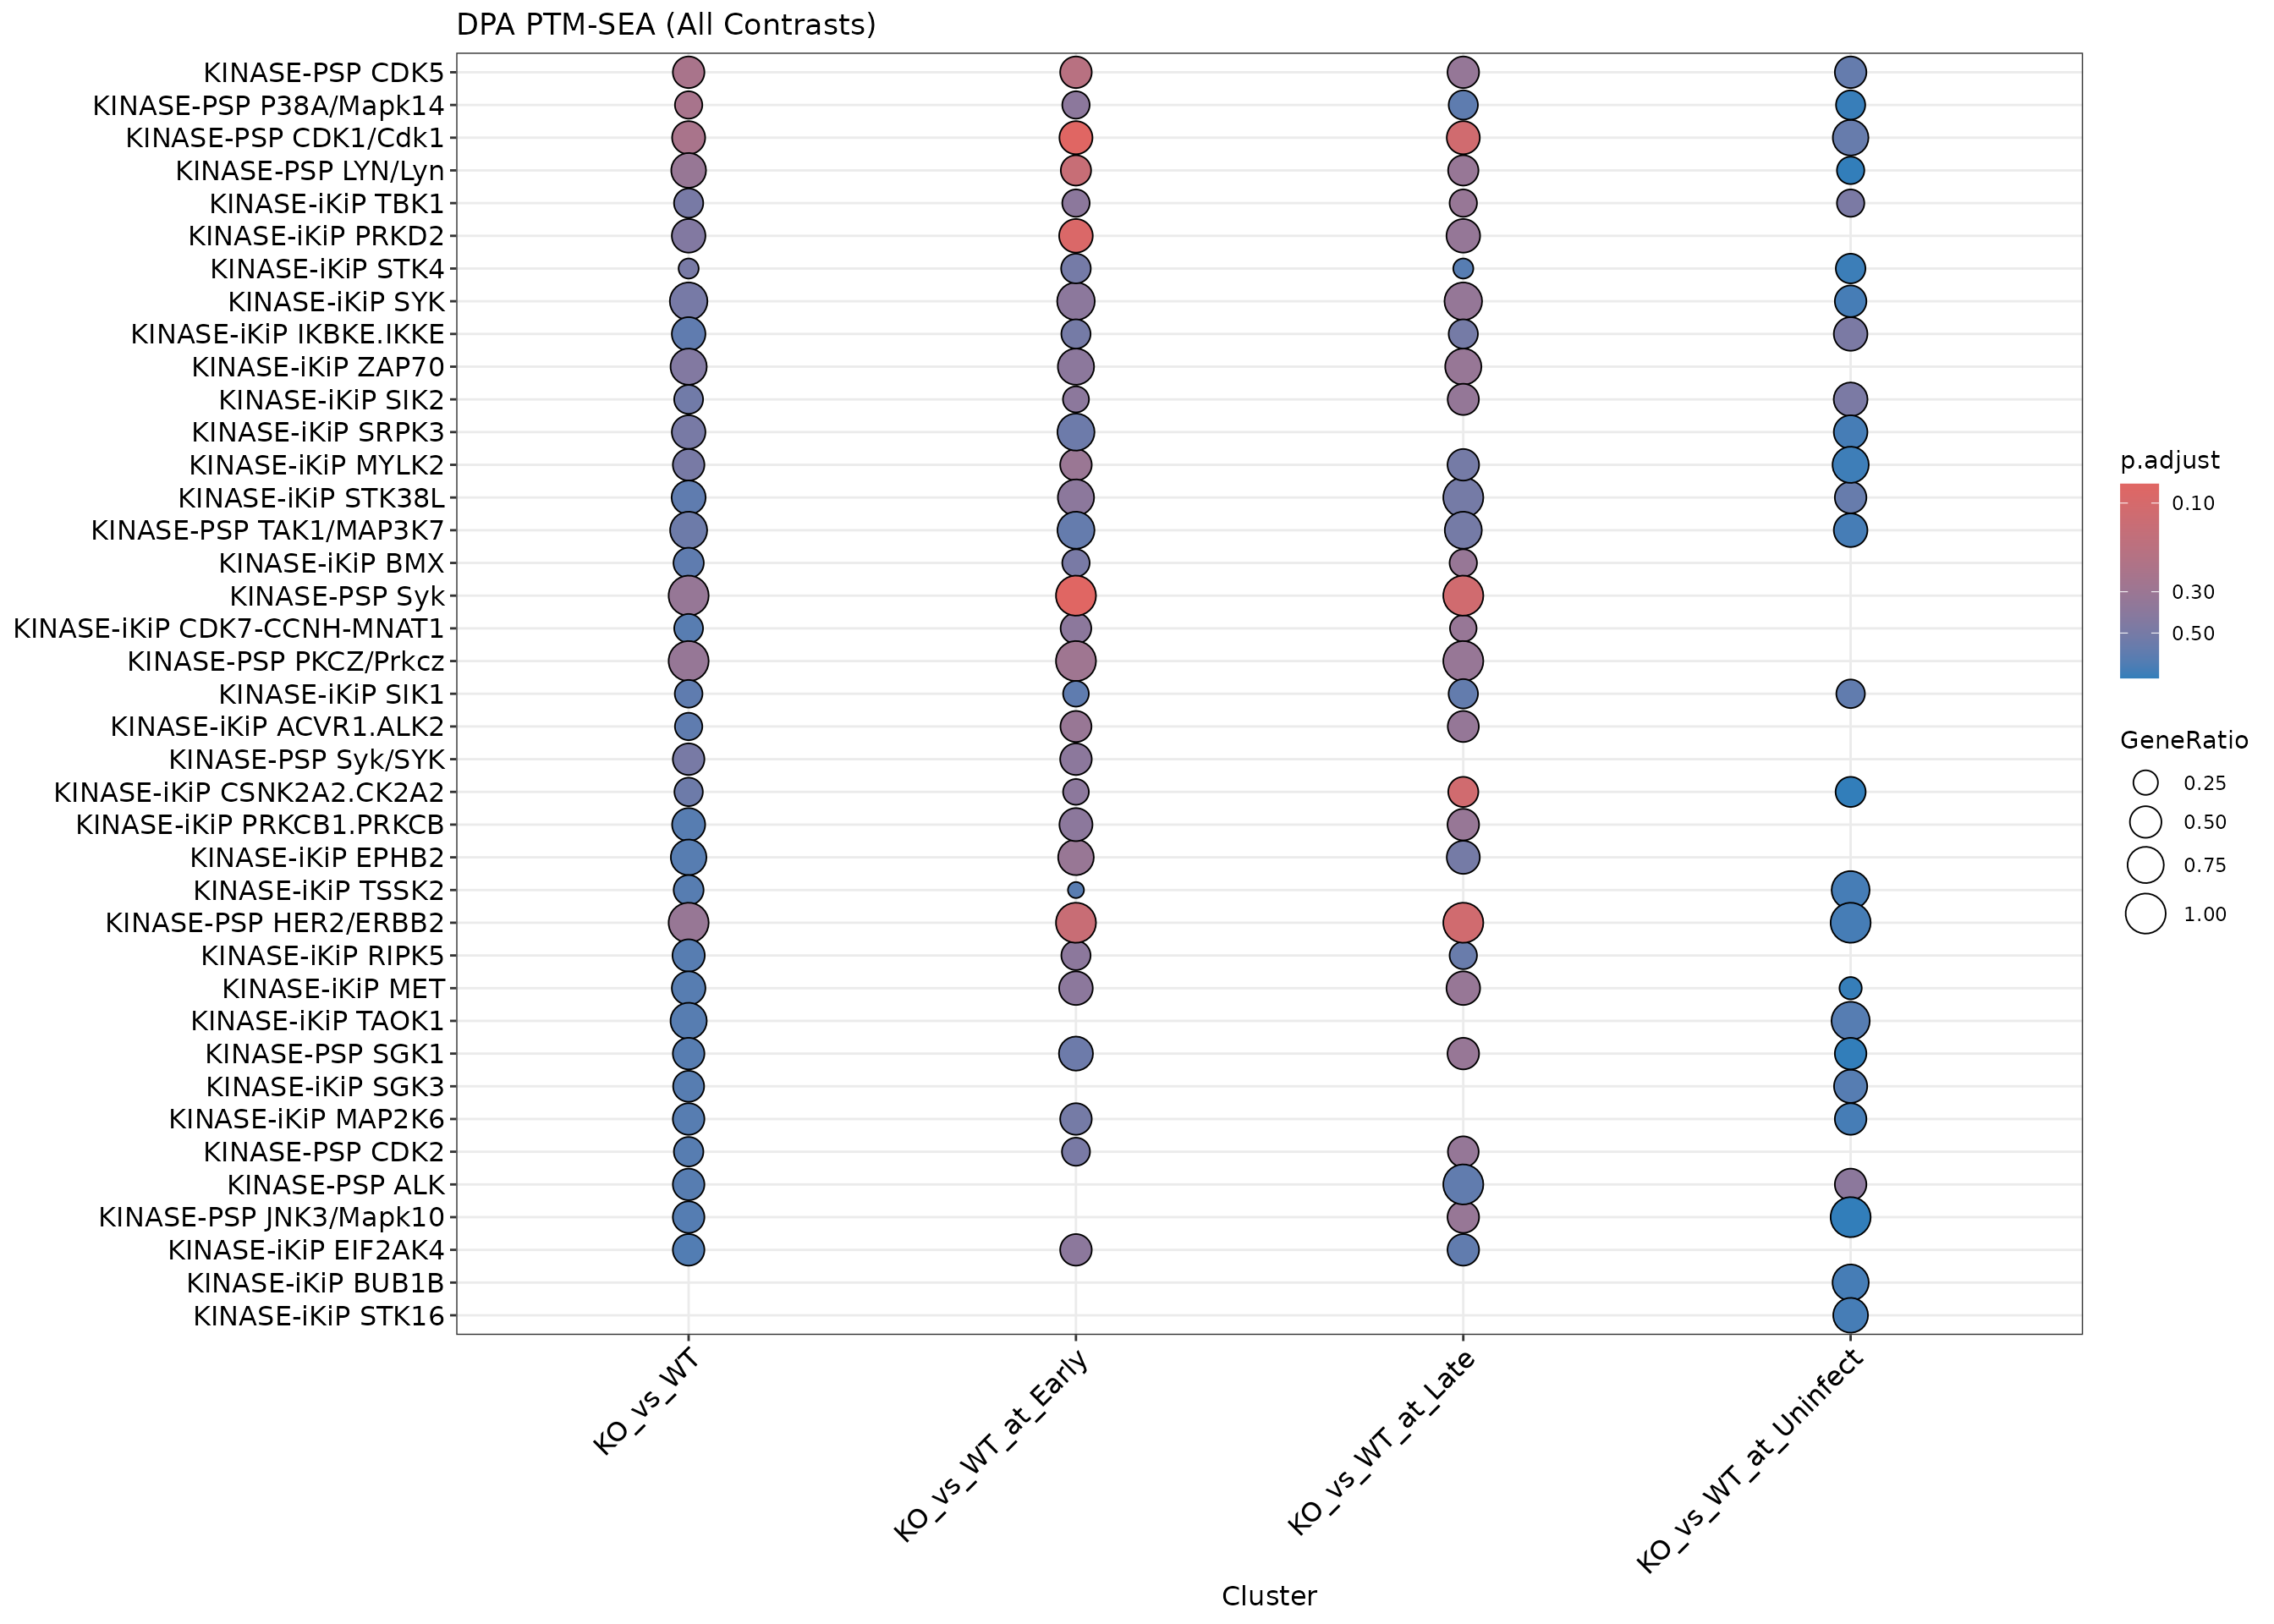
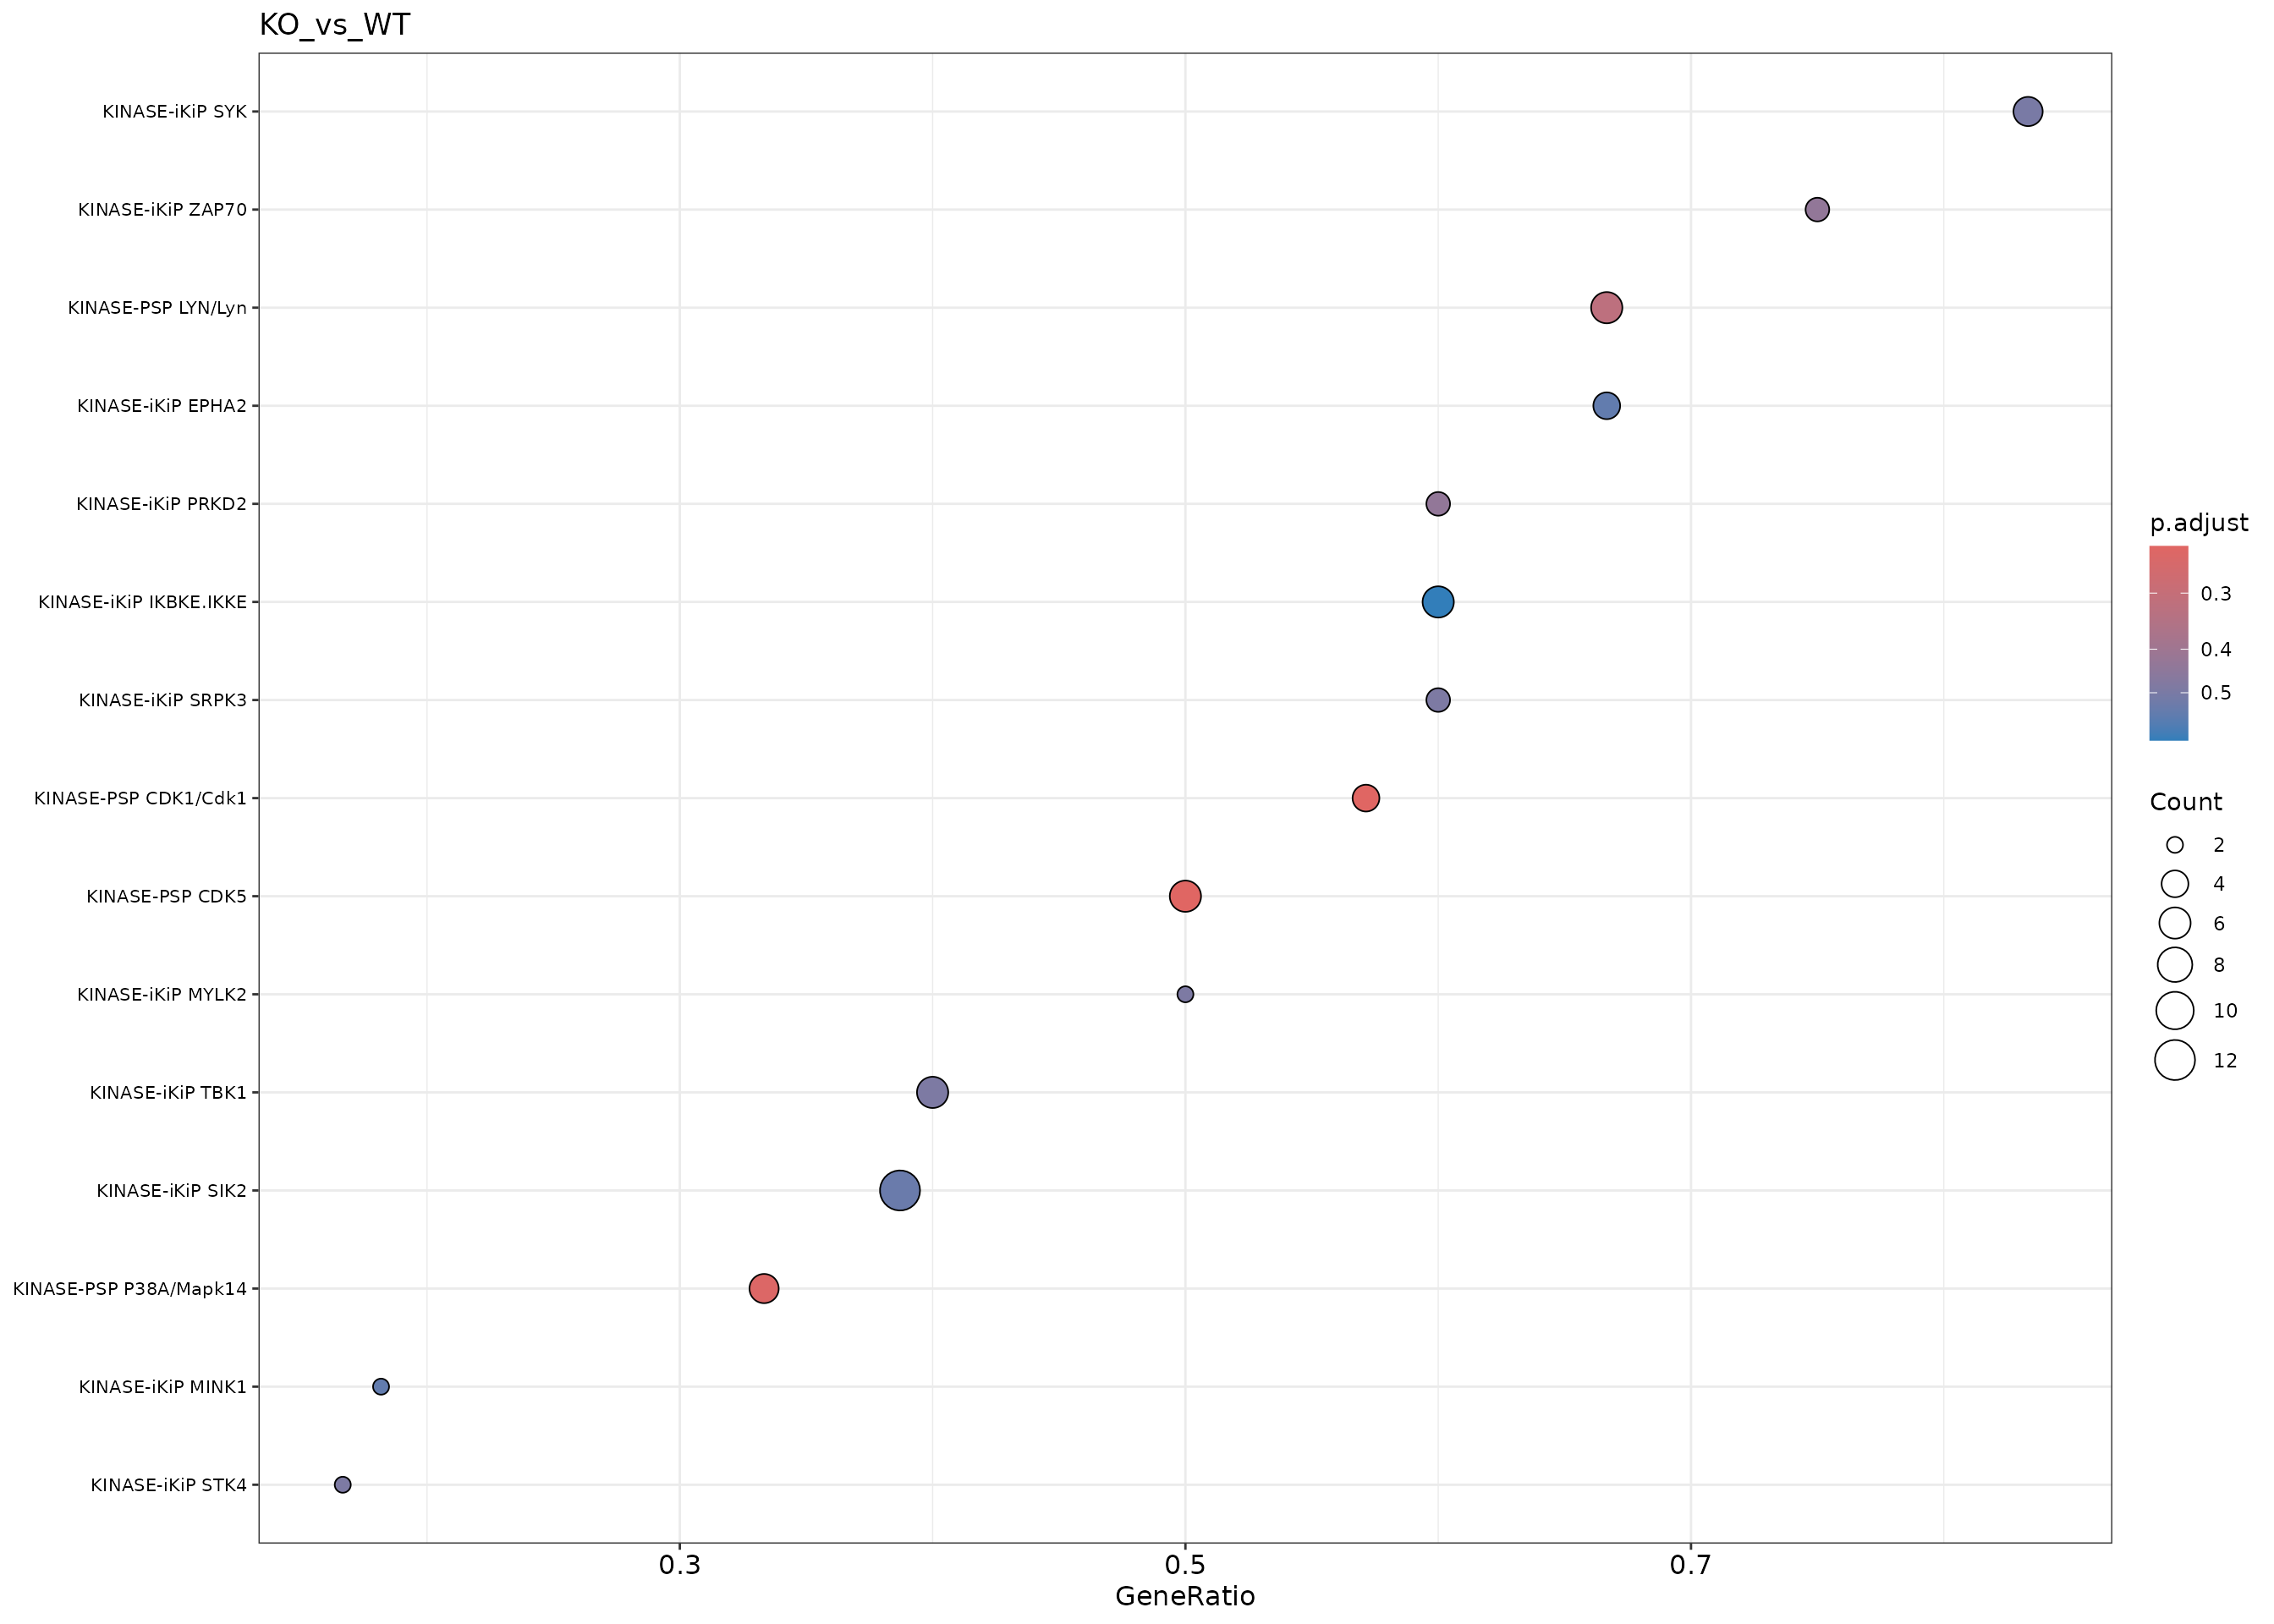
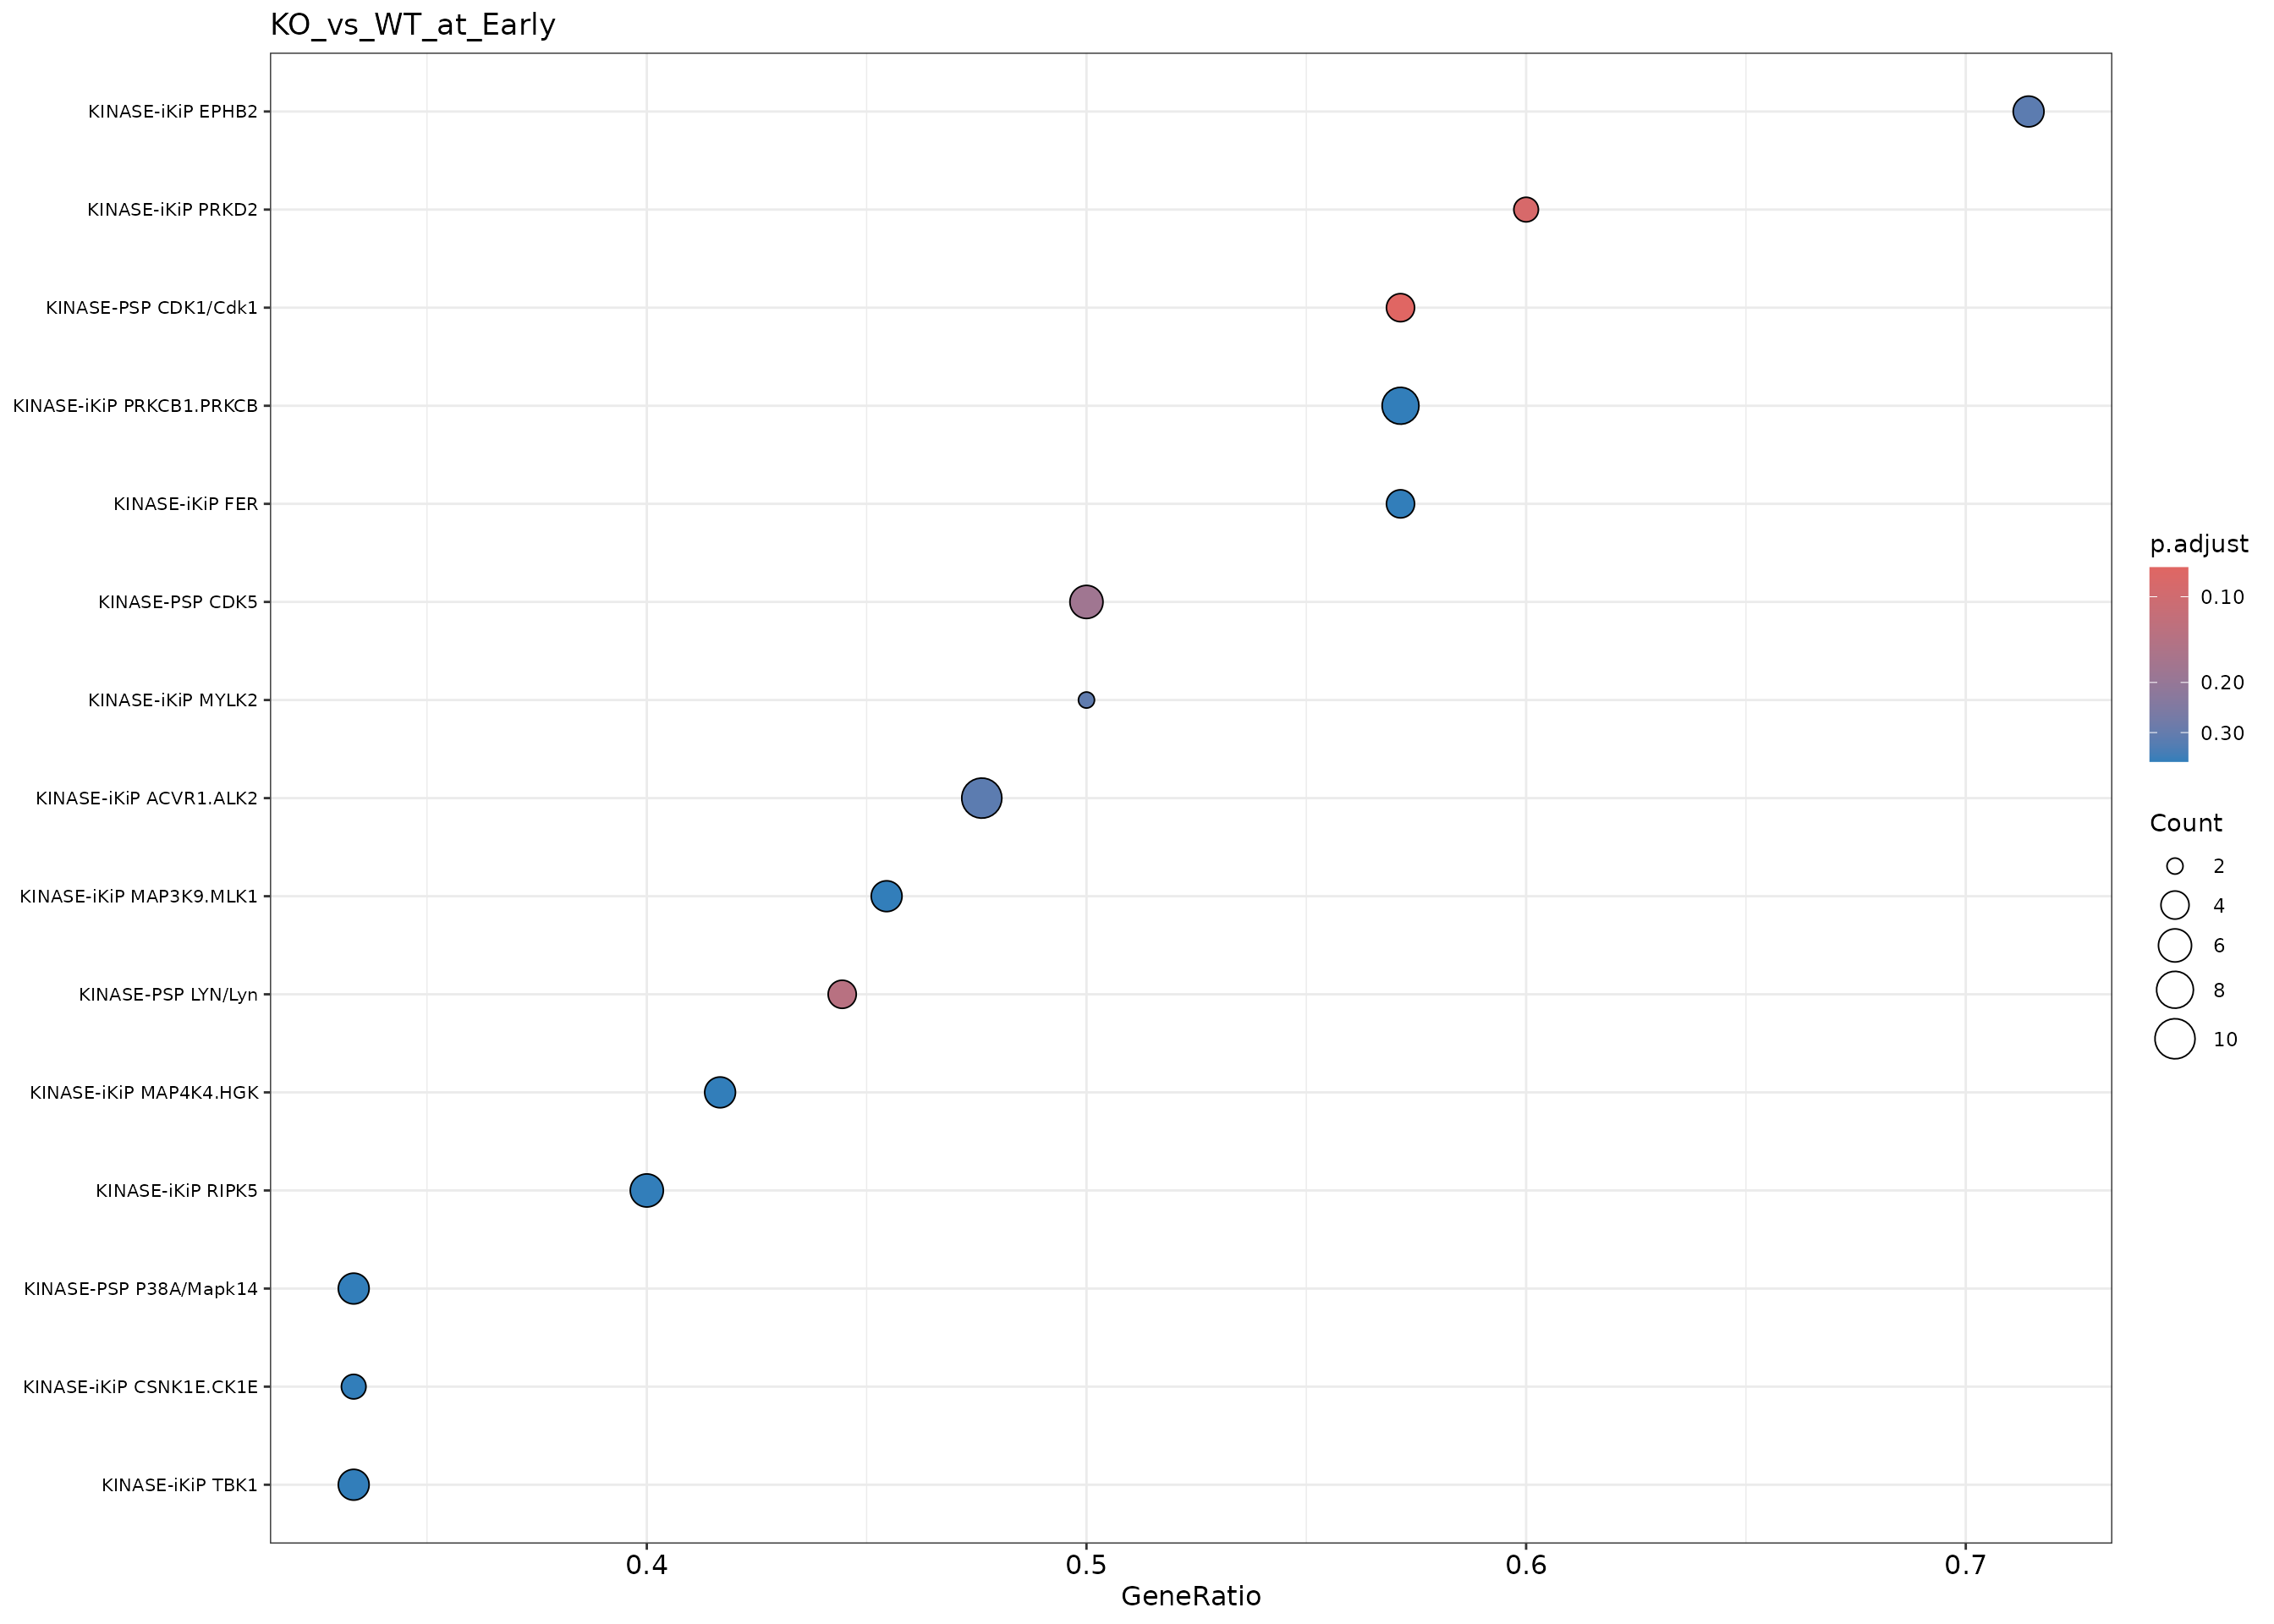
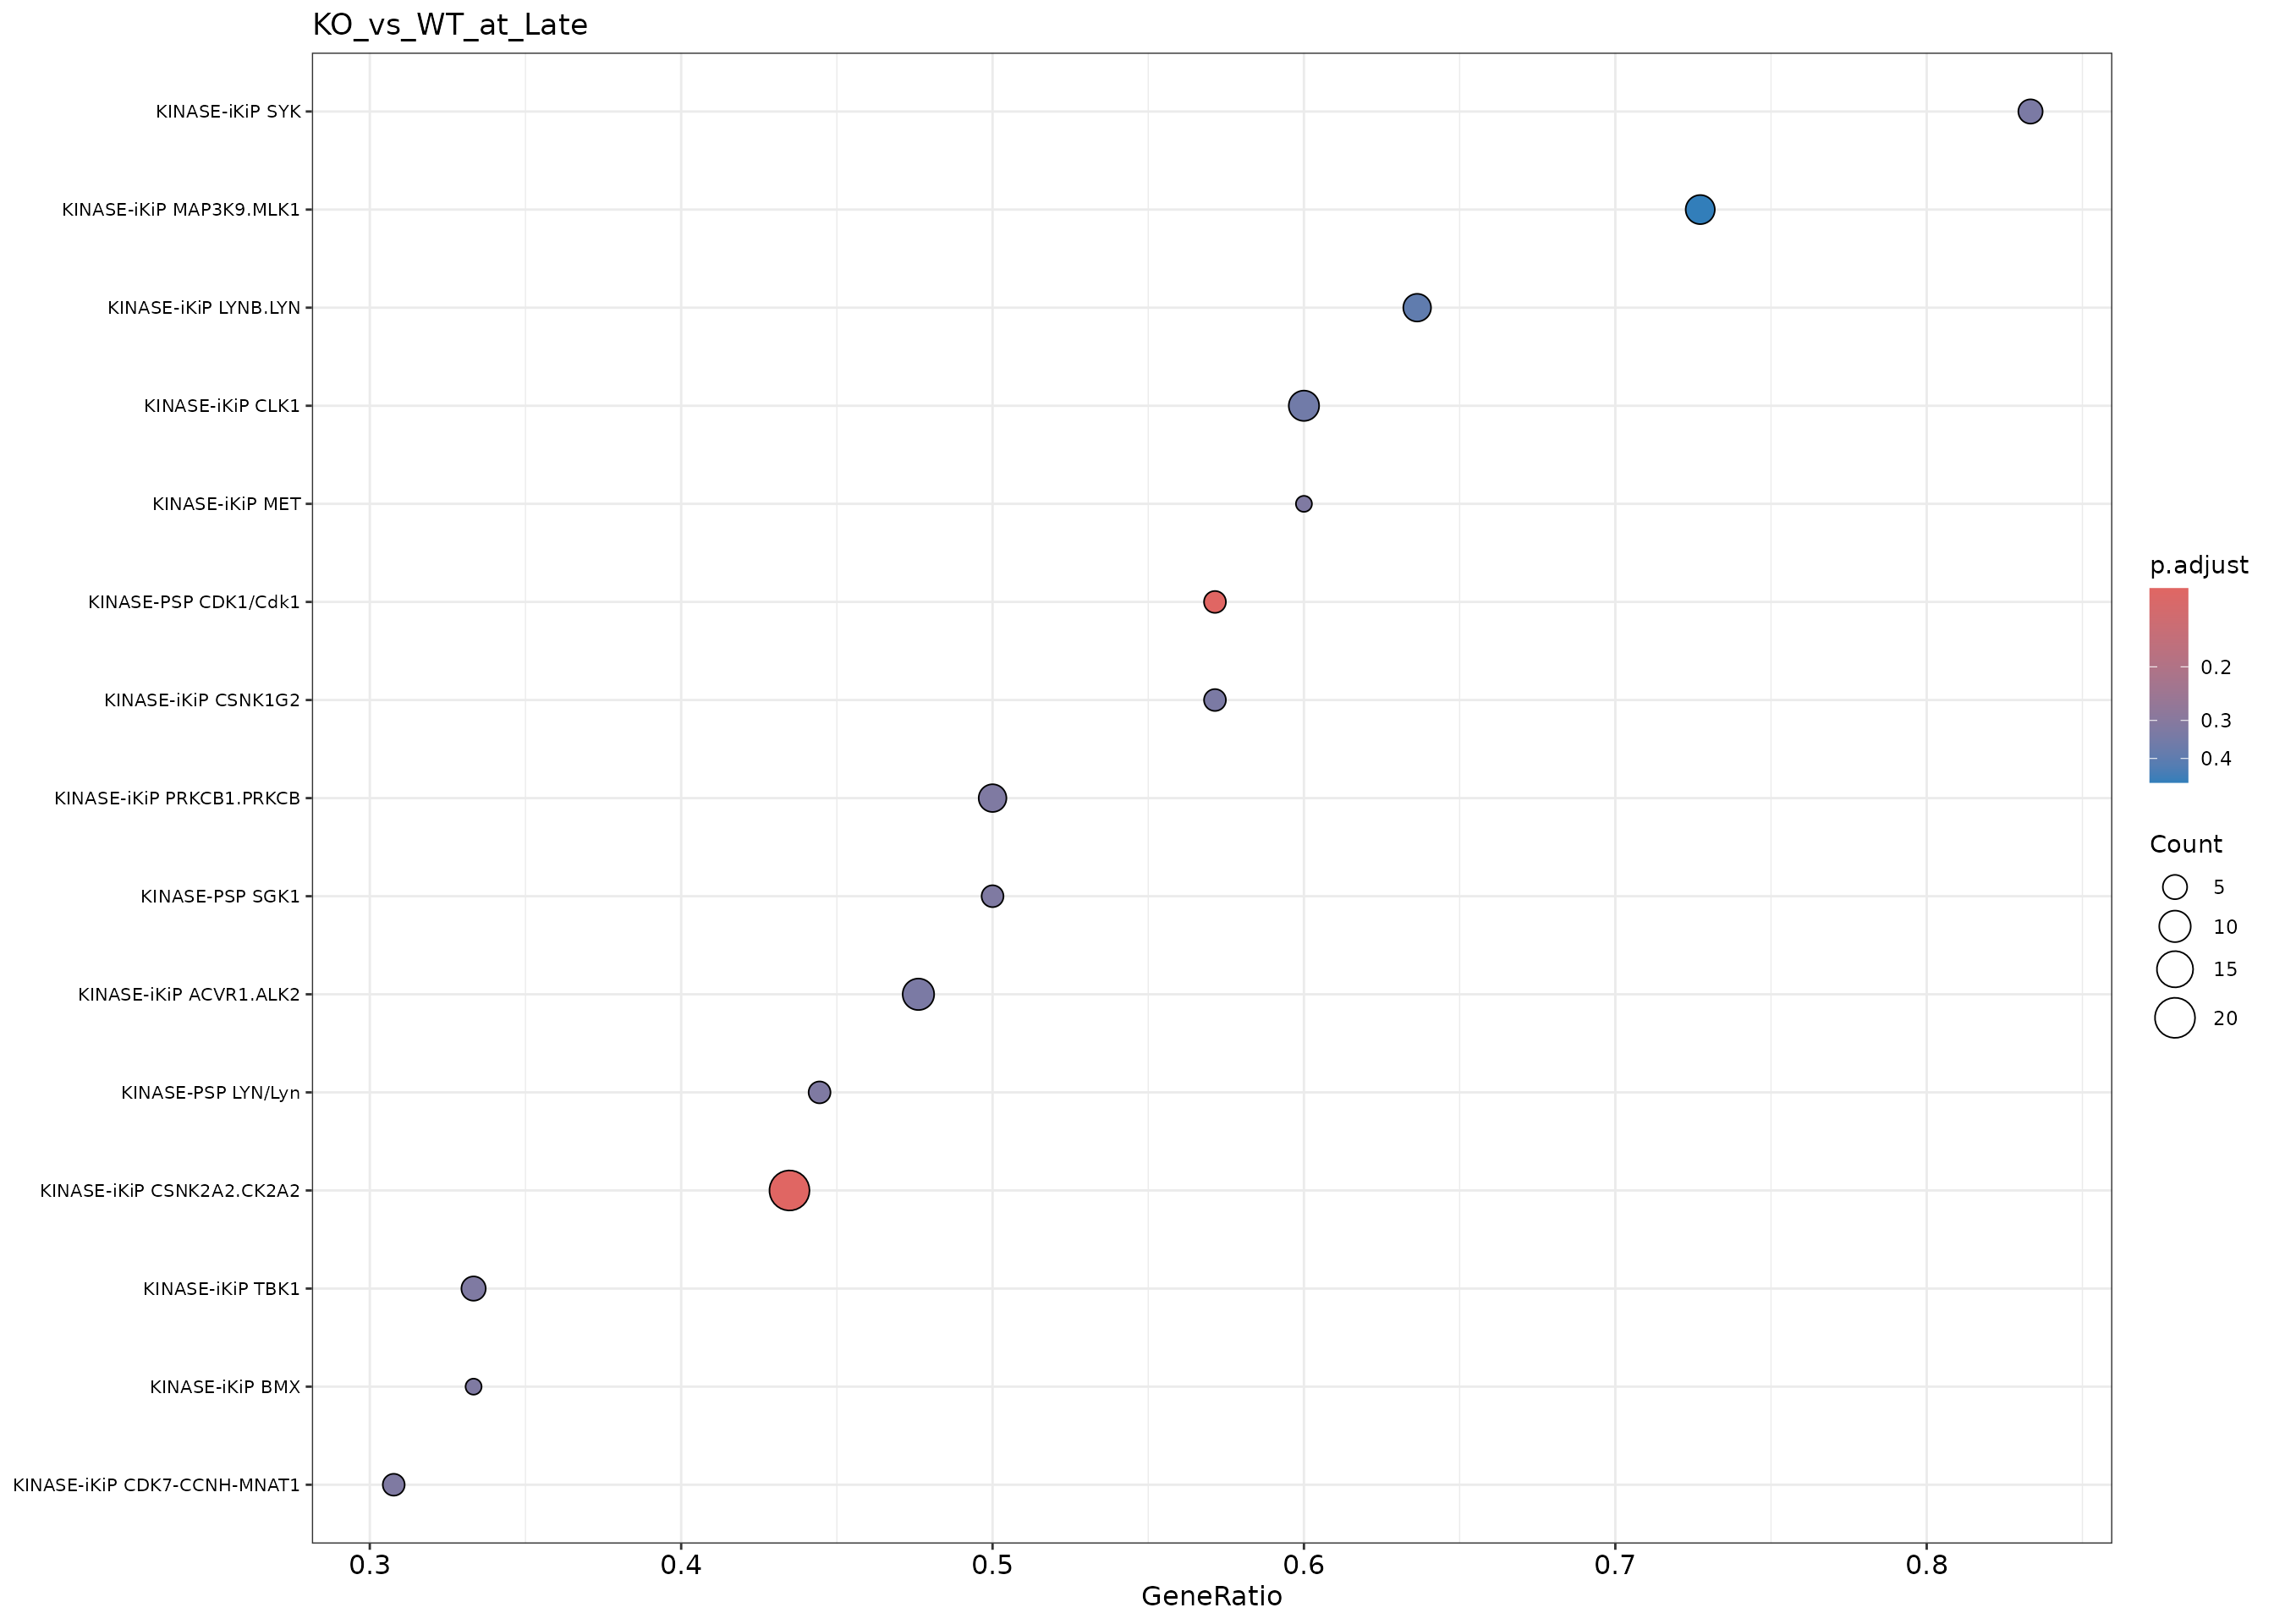
Individual Contrasts
for (ct in names(results)) {
  cat("\n\n### ", ct, "\n\n")

  res <- results[[ct]]

  # Check if there are any results to plot (dotplot fails on empty data)
  n_results <- nrow(res@result)
  if (n_results == 0) {
    cat("No pathways met the pvalue cutoff for this contrast.\n\n")
    next
  }

  p <- dotplot(res, showCategory = 15, title = ct) +
    theme(axis.text.y = element_text(size = 8))
  print(p)

  # Show top pathways table
  top_res <- res@result |>
    as_tibble() |>
    filter(p.adjust < 0.25) |>
    arrange(pvalue) |>
    head(10) |>
    select(ID, NES, pvalue, p.adjust, setSize) |>
    mutate(
      NES = round(NES, 3),
      pvalue = signif(pvalue, 3),
      p.adjust = signif(p.adjust, 3)
    )
  print(htmltools::tagList(
    DT::datatable(top_res,
      extensions = "Buttons",
      options = list(
        pageLength = 10, scrollX = TRUE,
        dom = "Bfrtip", buttons = c("copy", "csv", "excel")
      ),
      caption = paste("Top Pathways -", ct)
    )
  ))
  cat("\n\n")
}
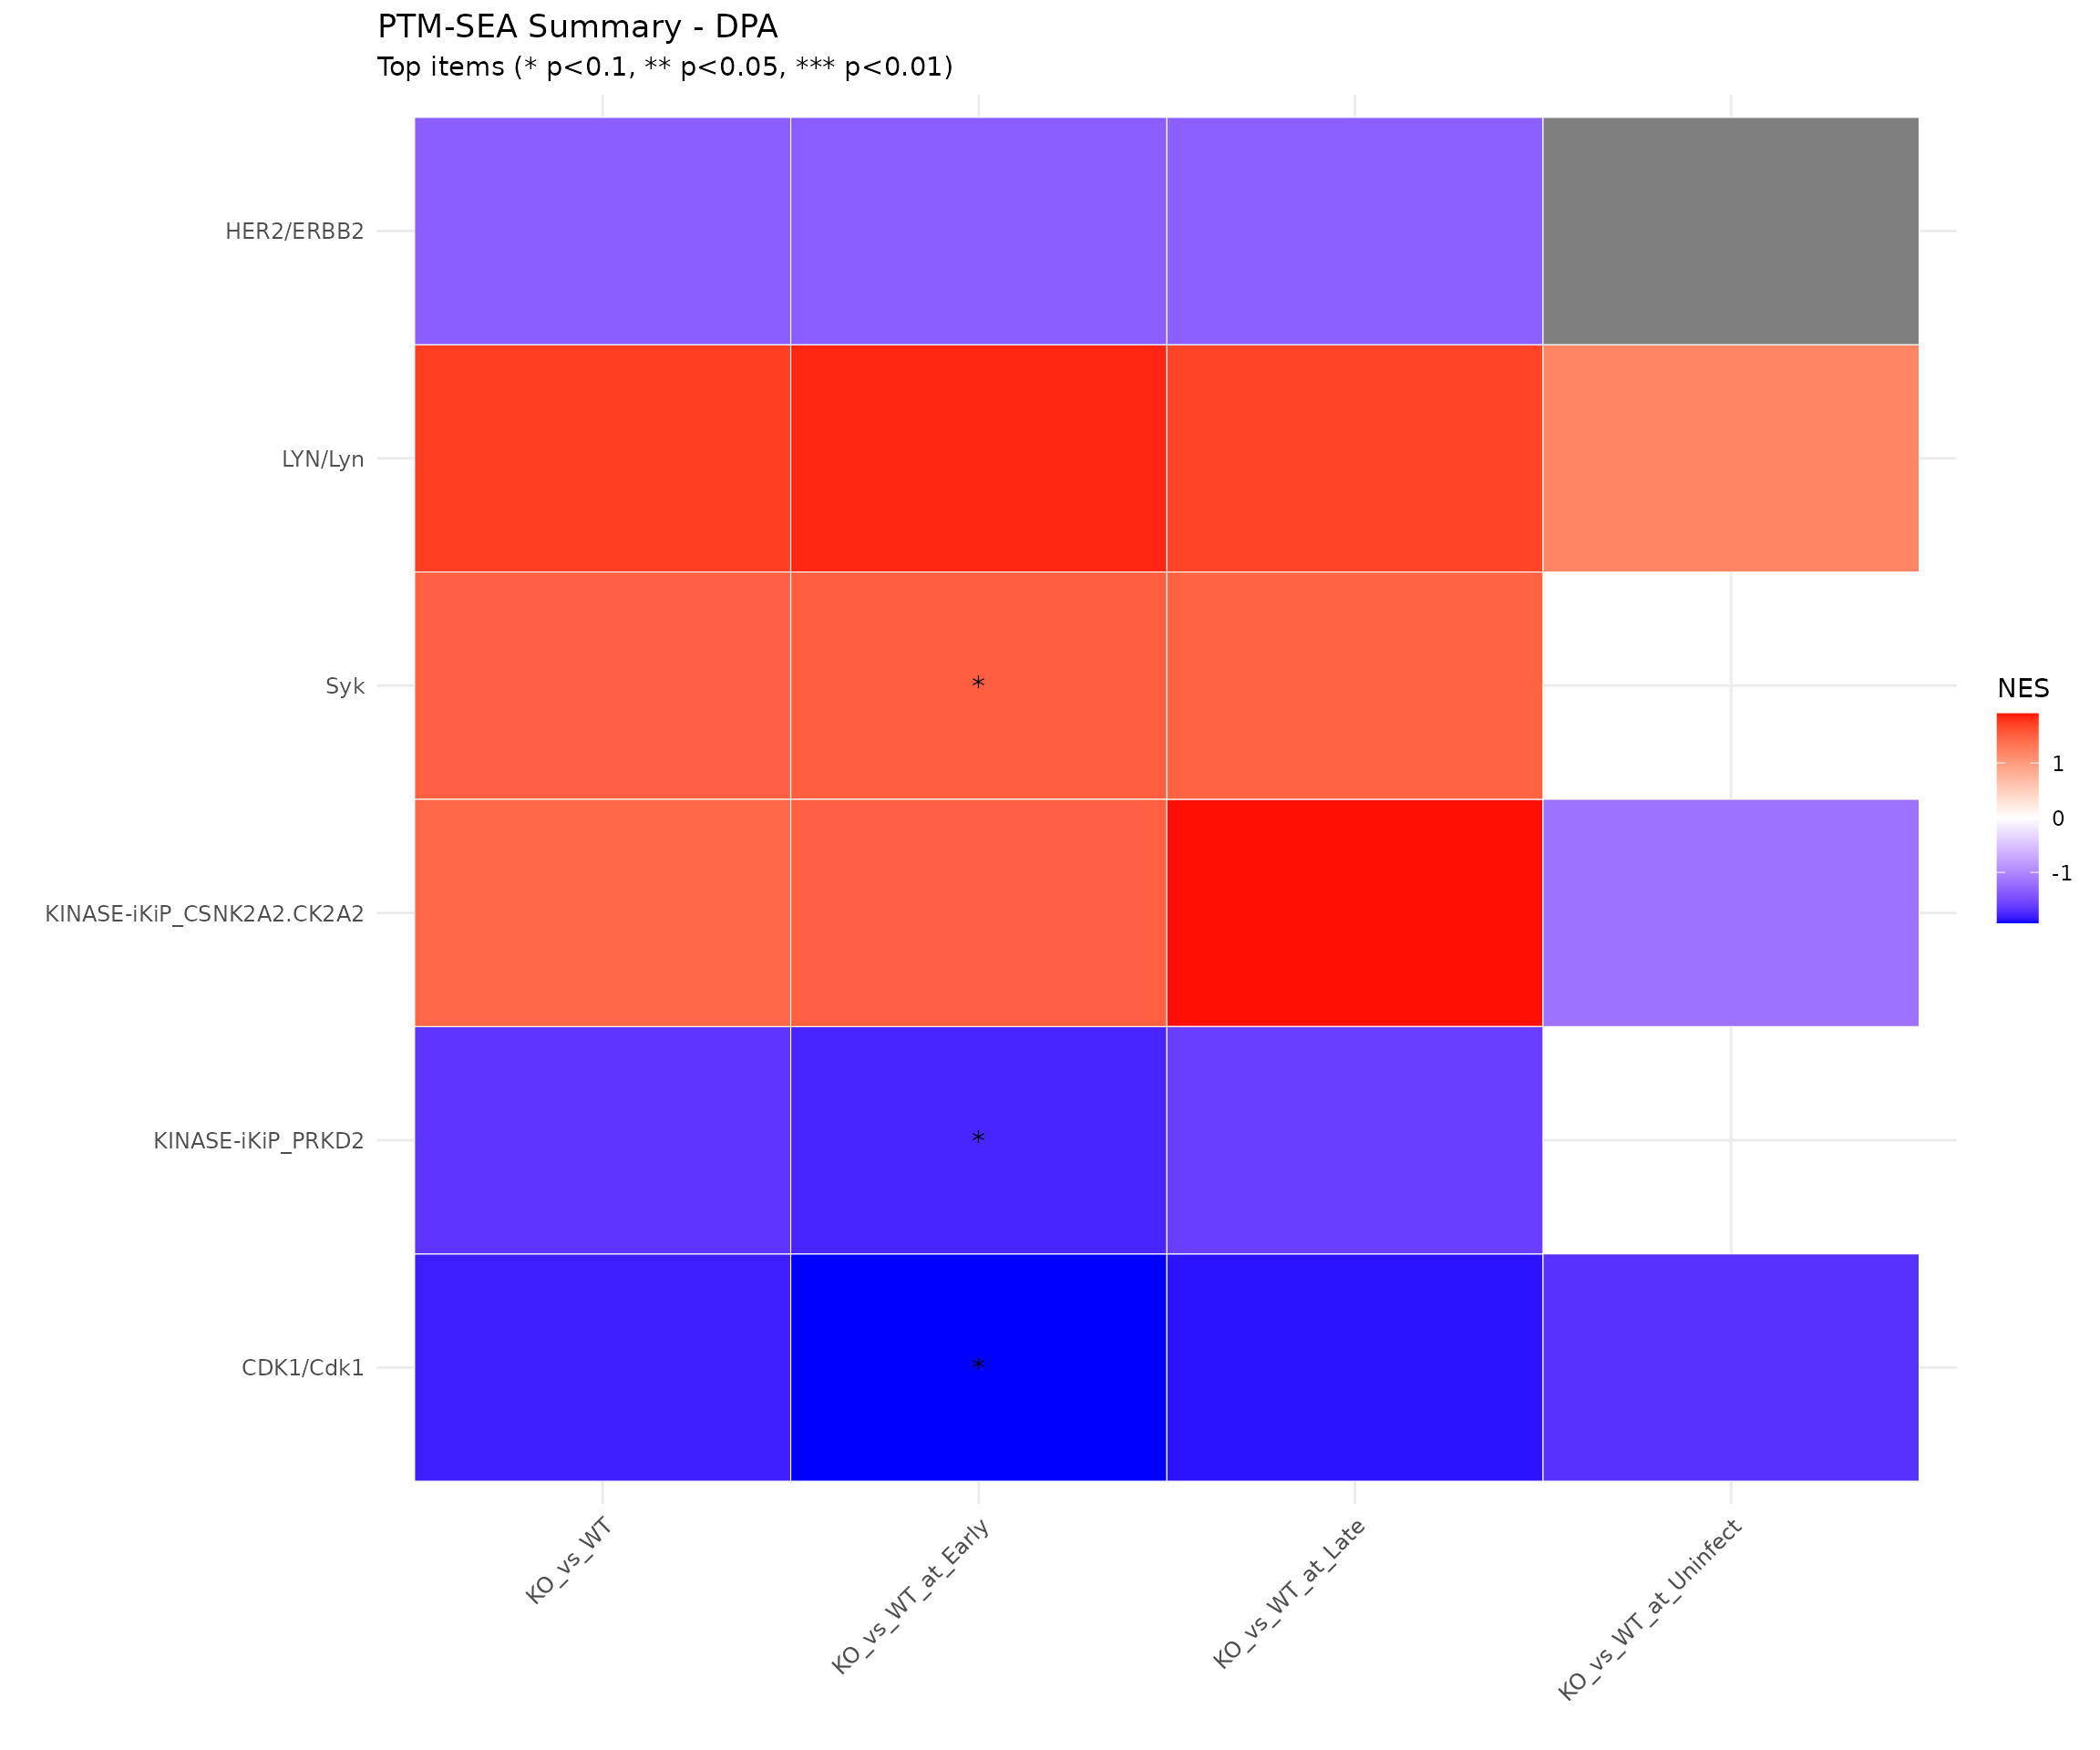
Summary Heatmap
stopifnot(
  "No GSEA results - check min_size parameter and sequence overlap" = nrow(all_clean) > 0
)

# Using shared heatmap function with pathway_short labels
plot_enrichment_heatmap(
  all_clean,
  item_col = "ID",
  fdr_col = "p.adjust",
  n_top = 25,
  item_label_col = "pathway_short",
  title = paste0("PTM-SEA Summary - ", params$analysis_type)
)
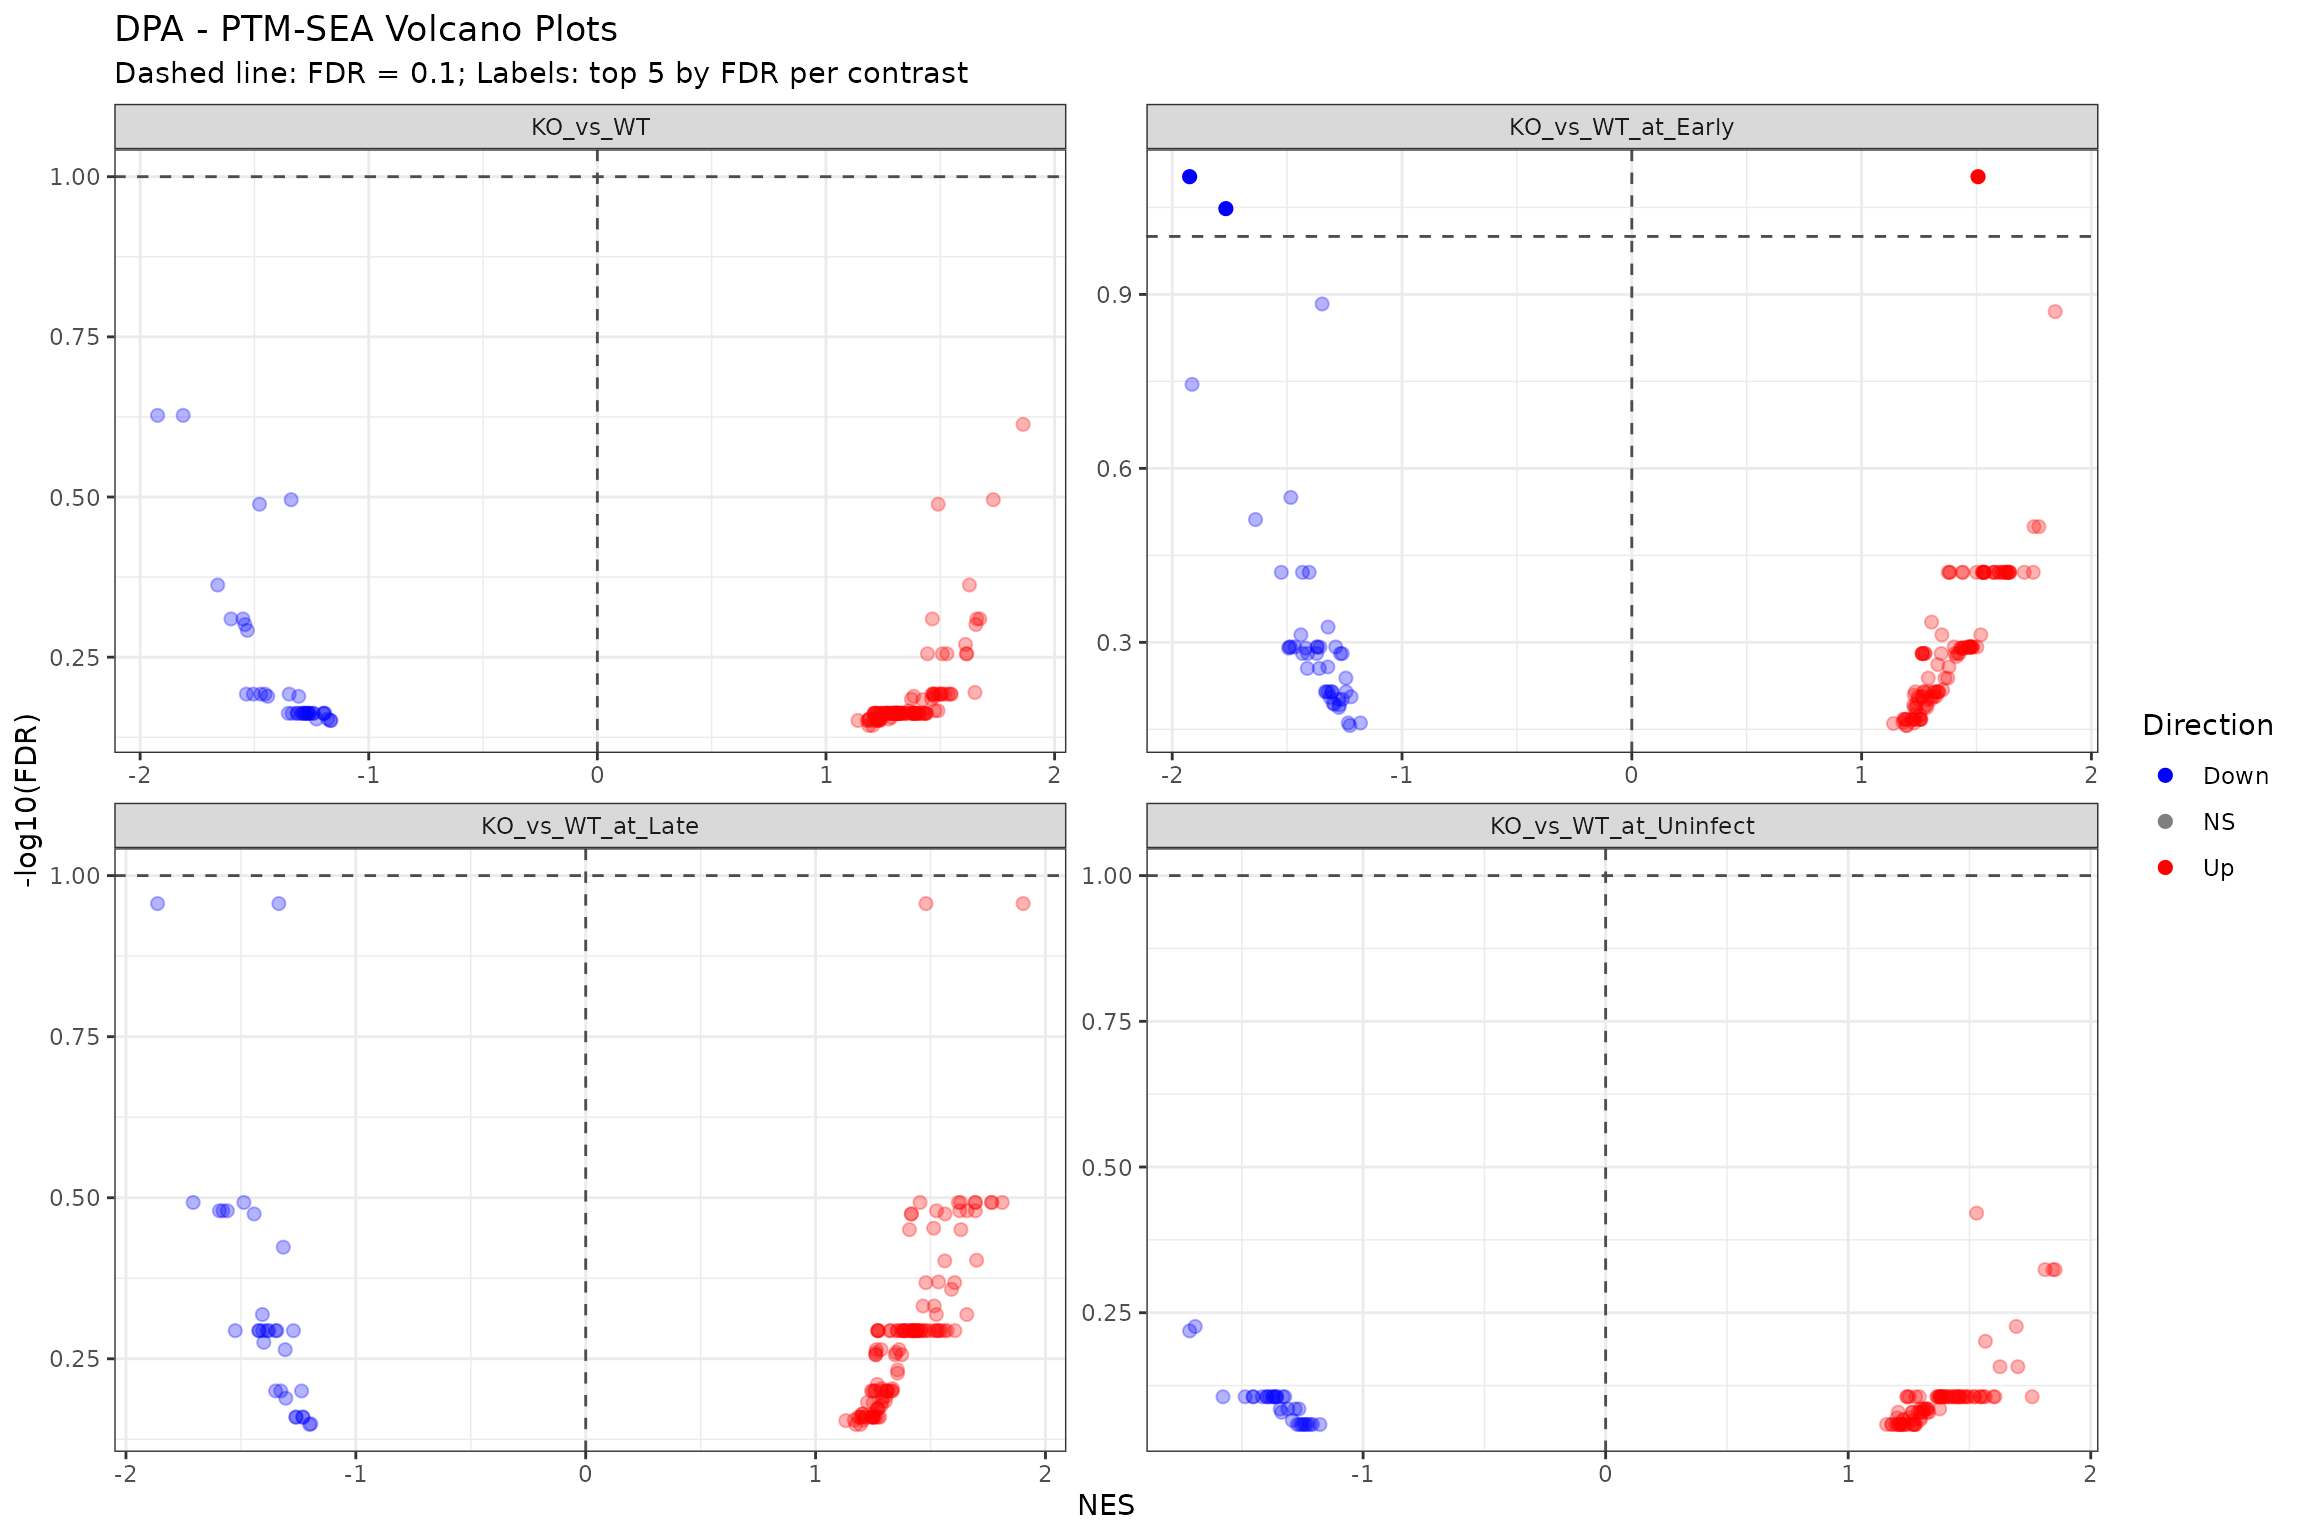
Volcano Plot
# Using shared volcano function
plot_enrichment_volcano(
  all_clean,
  item_col = "pathway_short",
  fdr_col = "p.adjust",
  title = paste(params$analysis_type, "- PTM-SEA Volcano Plots")
)
Export All GSEA Plots to PDF
# Export all GSEA enrichment plots to PDF using shared function
pdf_file <- file.path(output_dir, paste0("GSEA_plots_", params$analysis_type, ".pdf"))
n_gsea_plots <- export_gsea_plots_pdf(
results, pdf_file,
prefix_pattern = "^(KINASE|PERT|PATH|DISEASE)-PSP_"
)
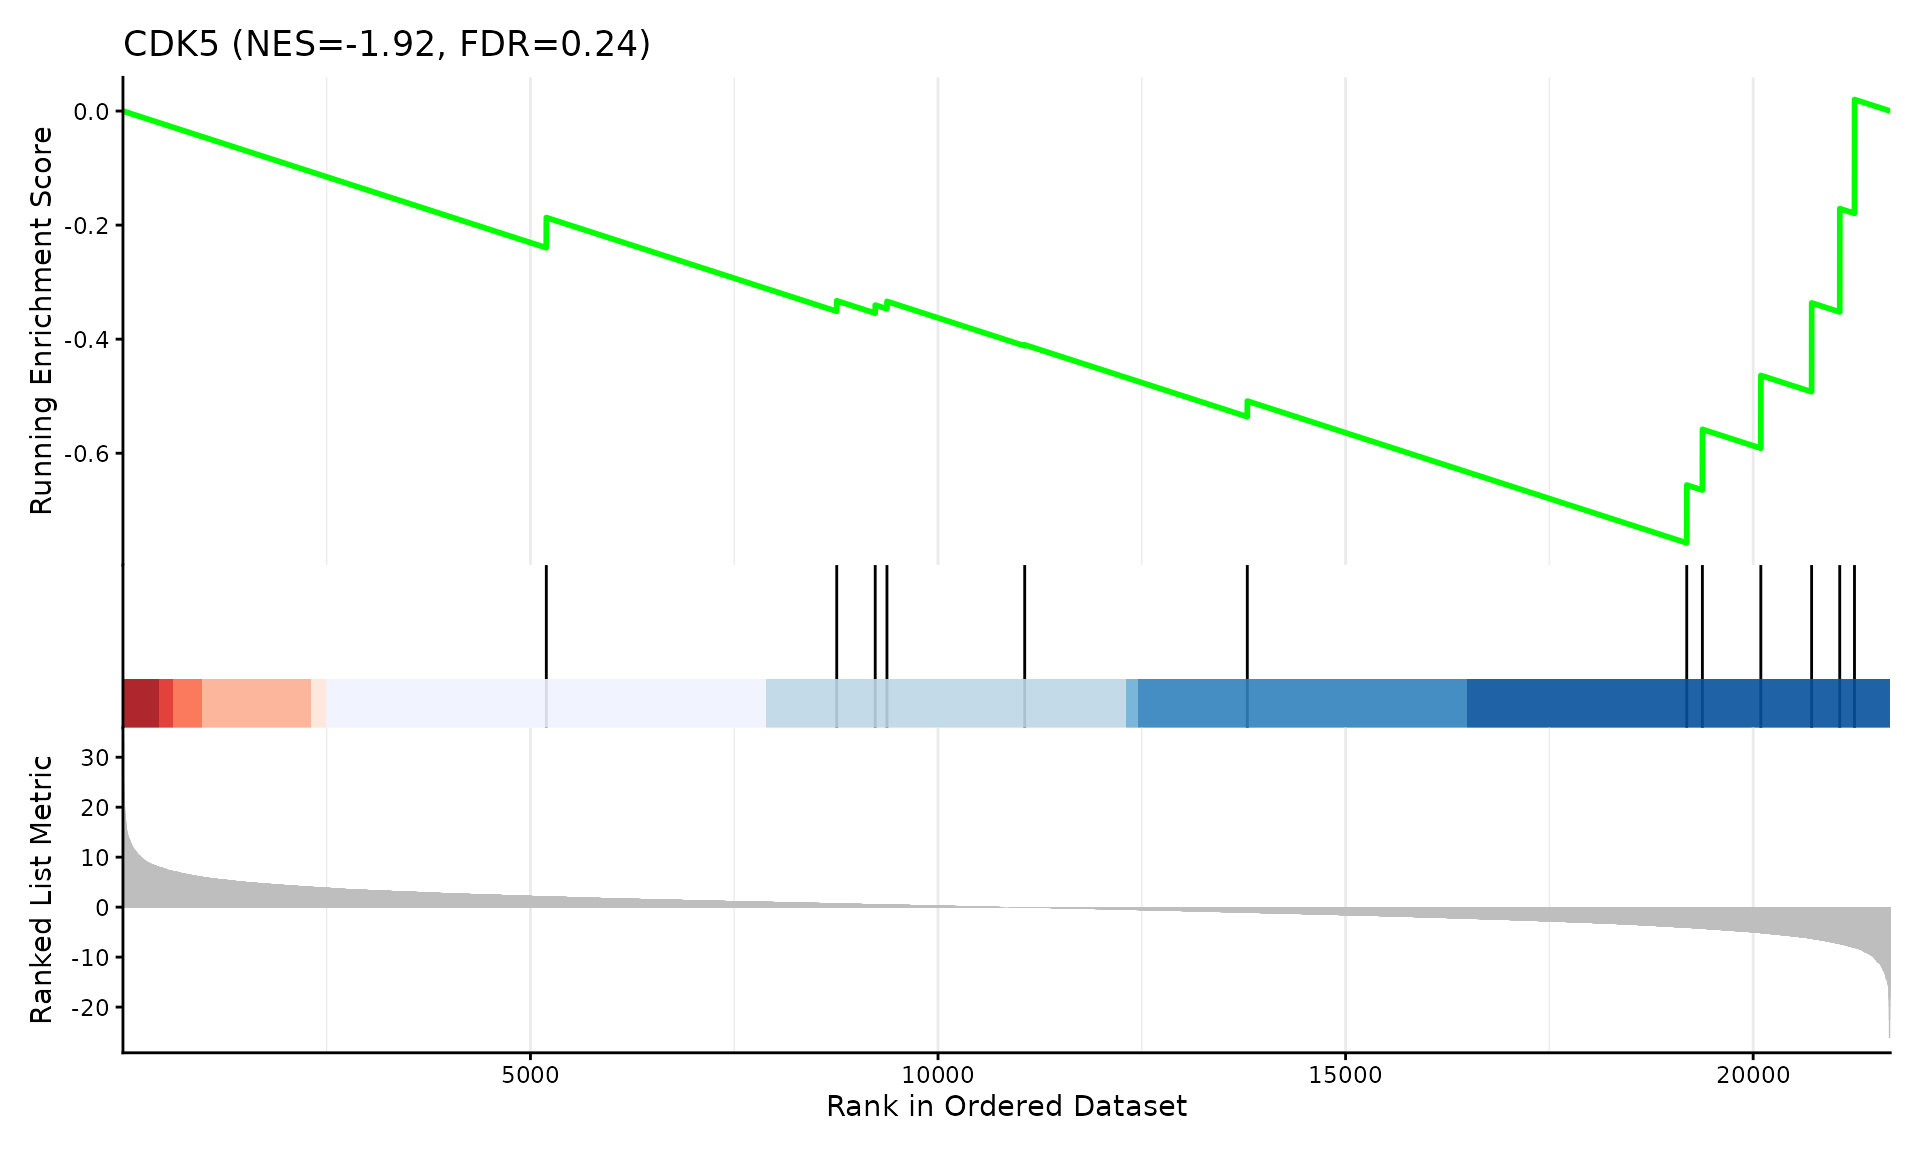
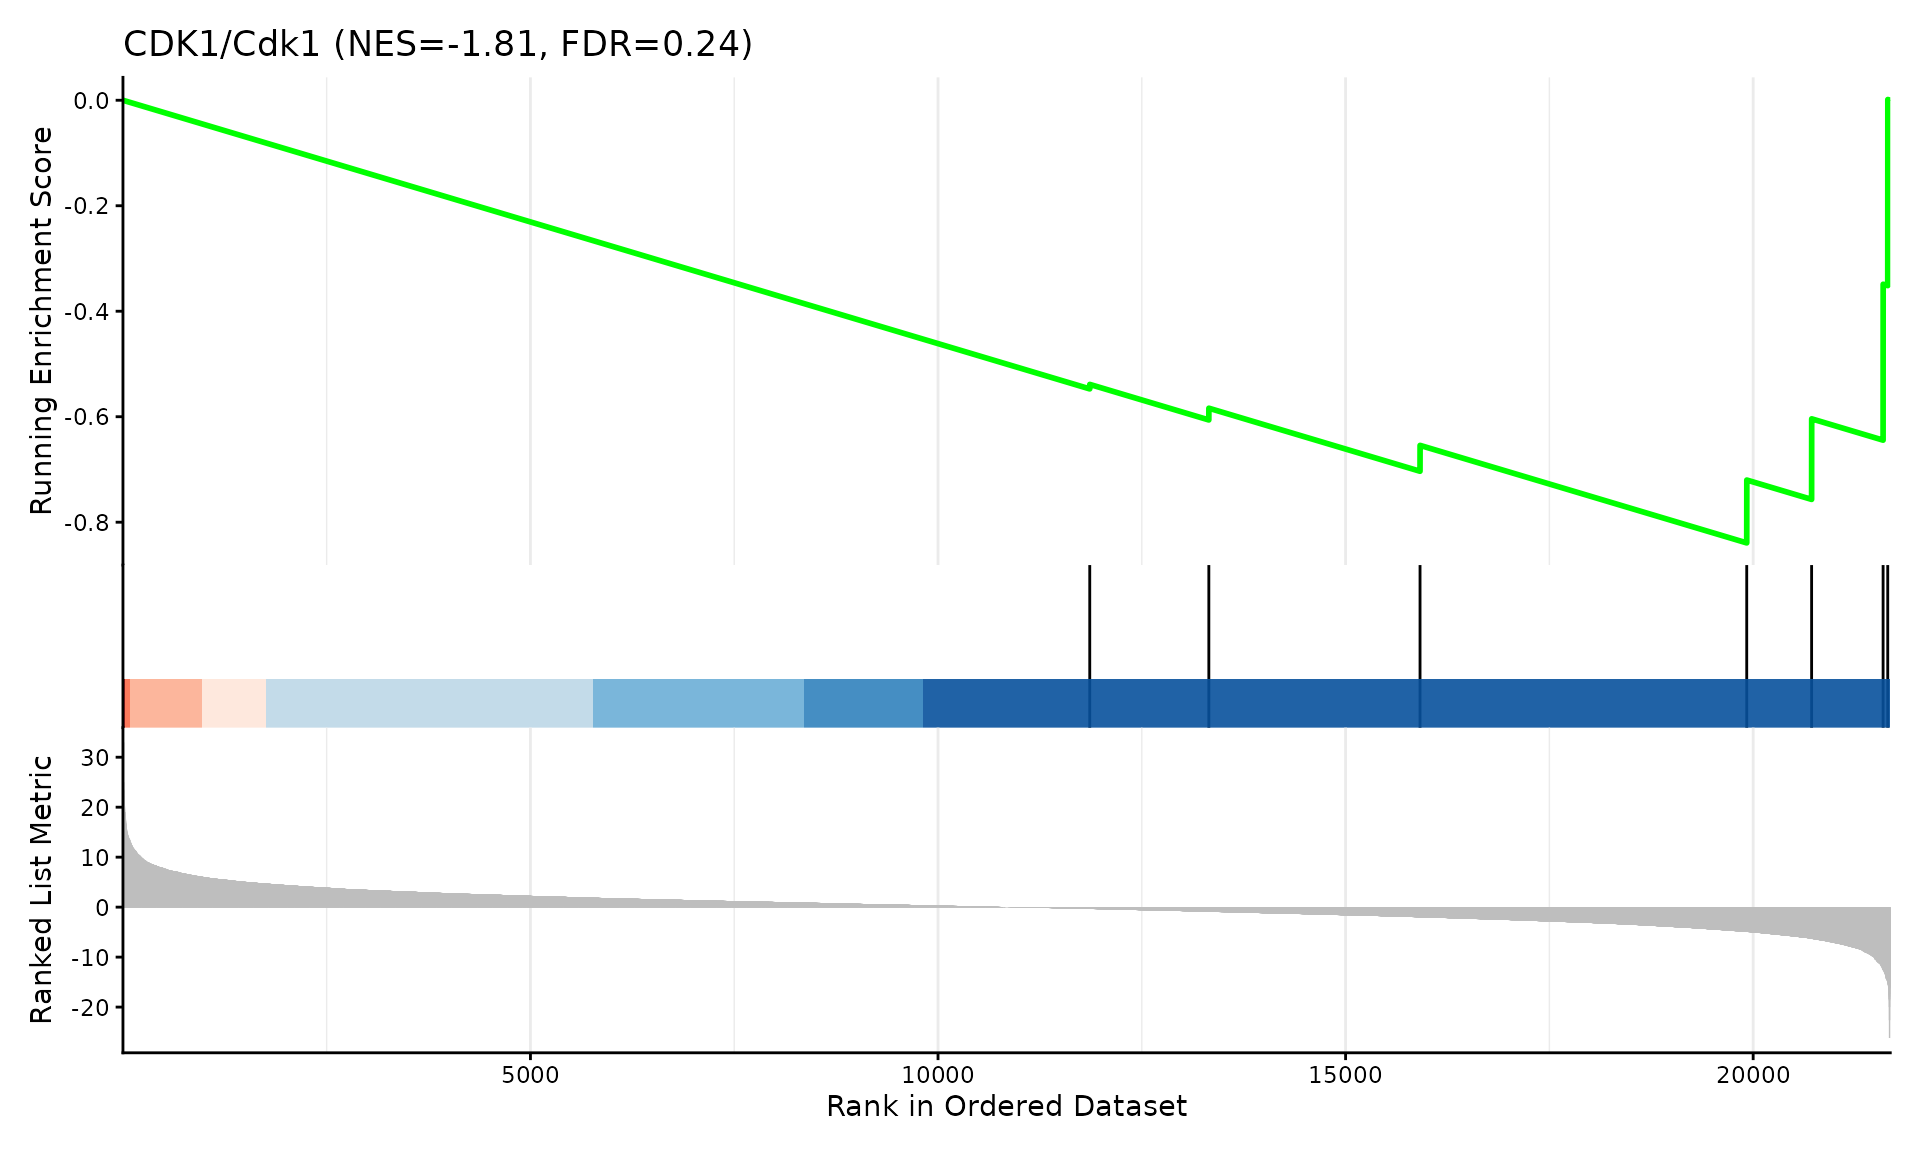
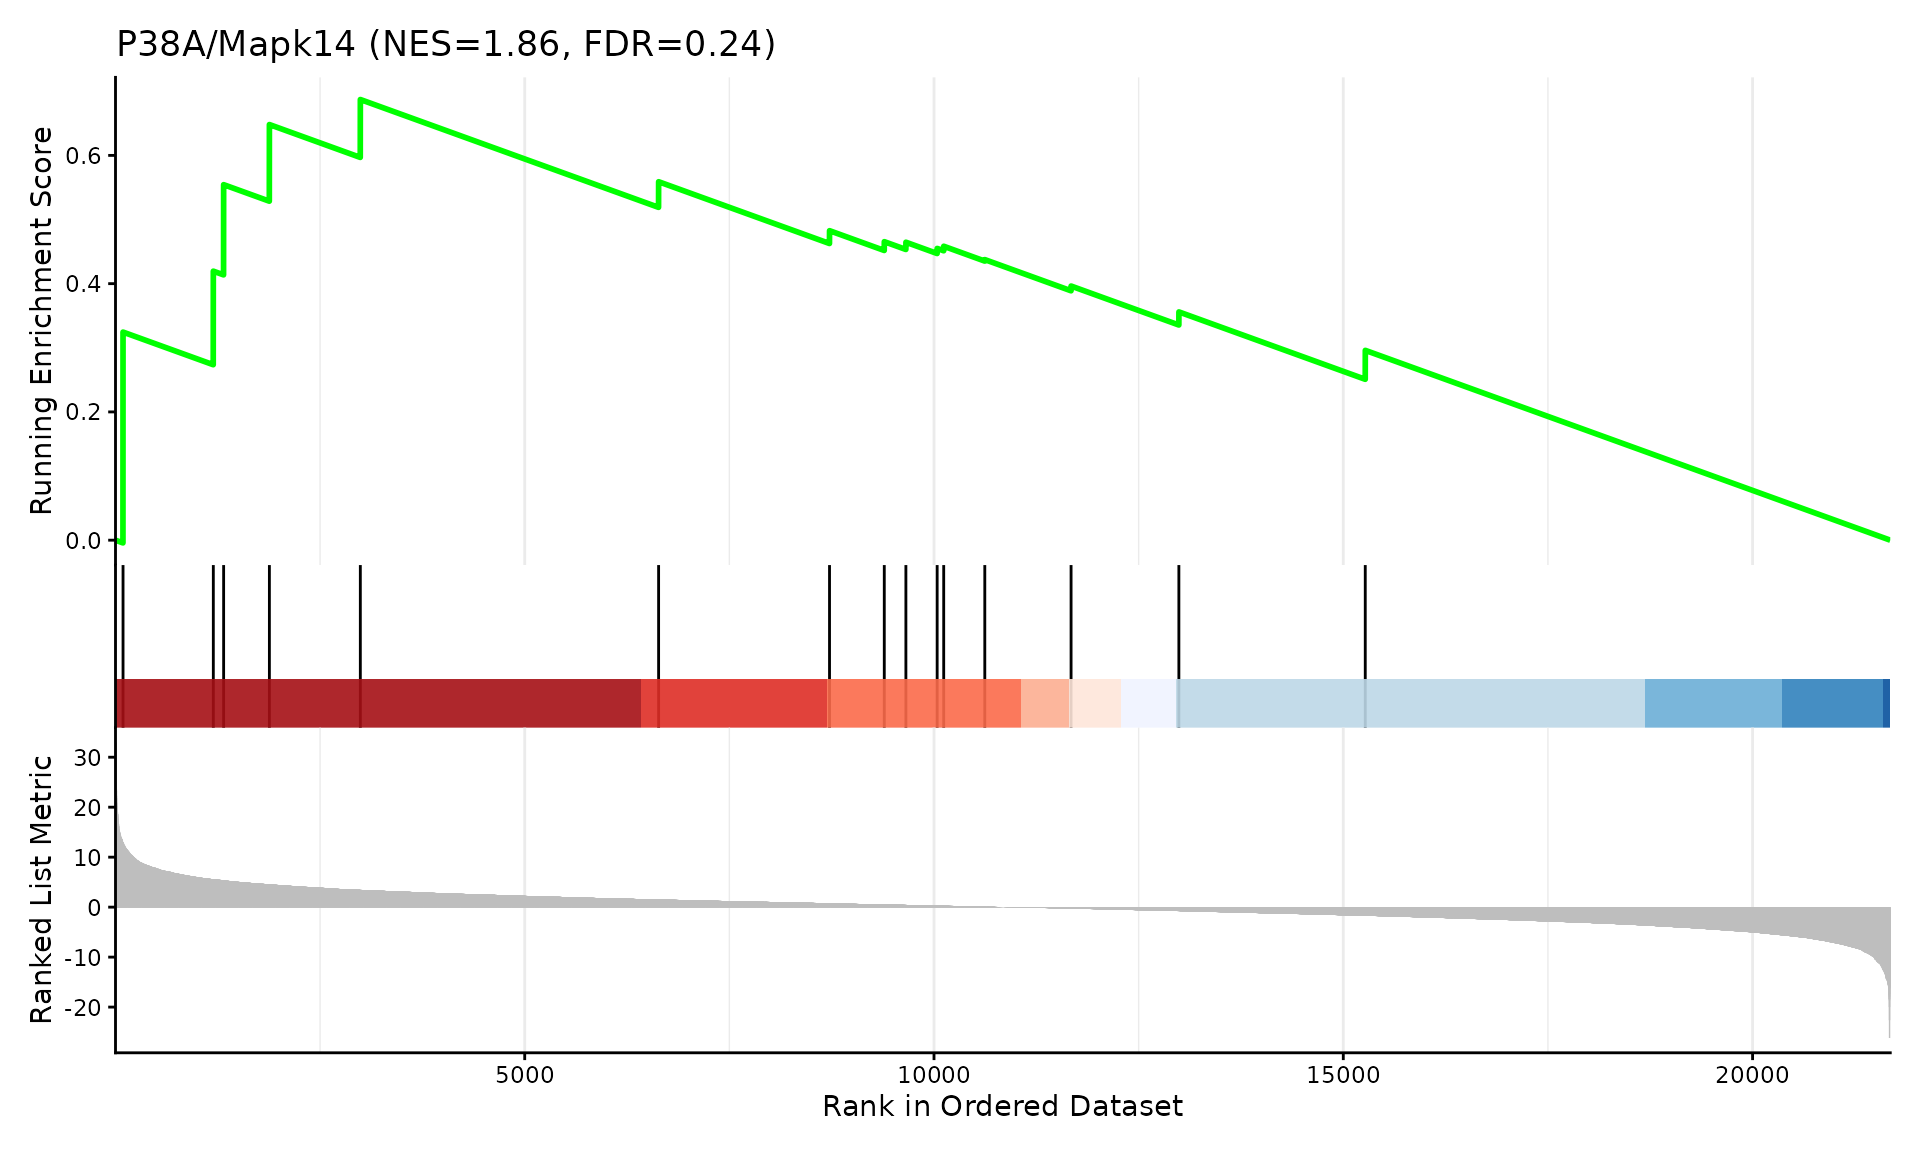
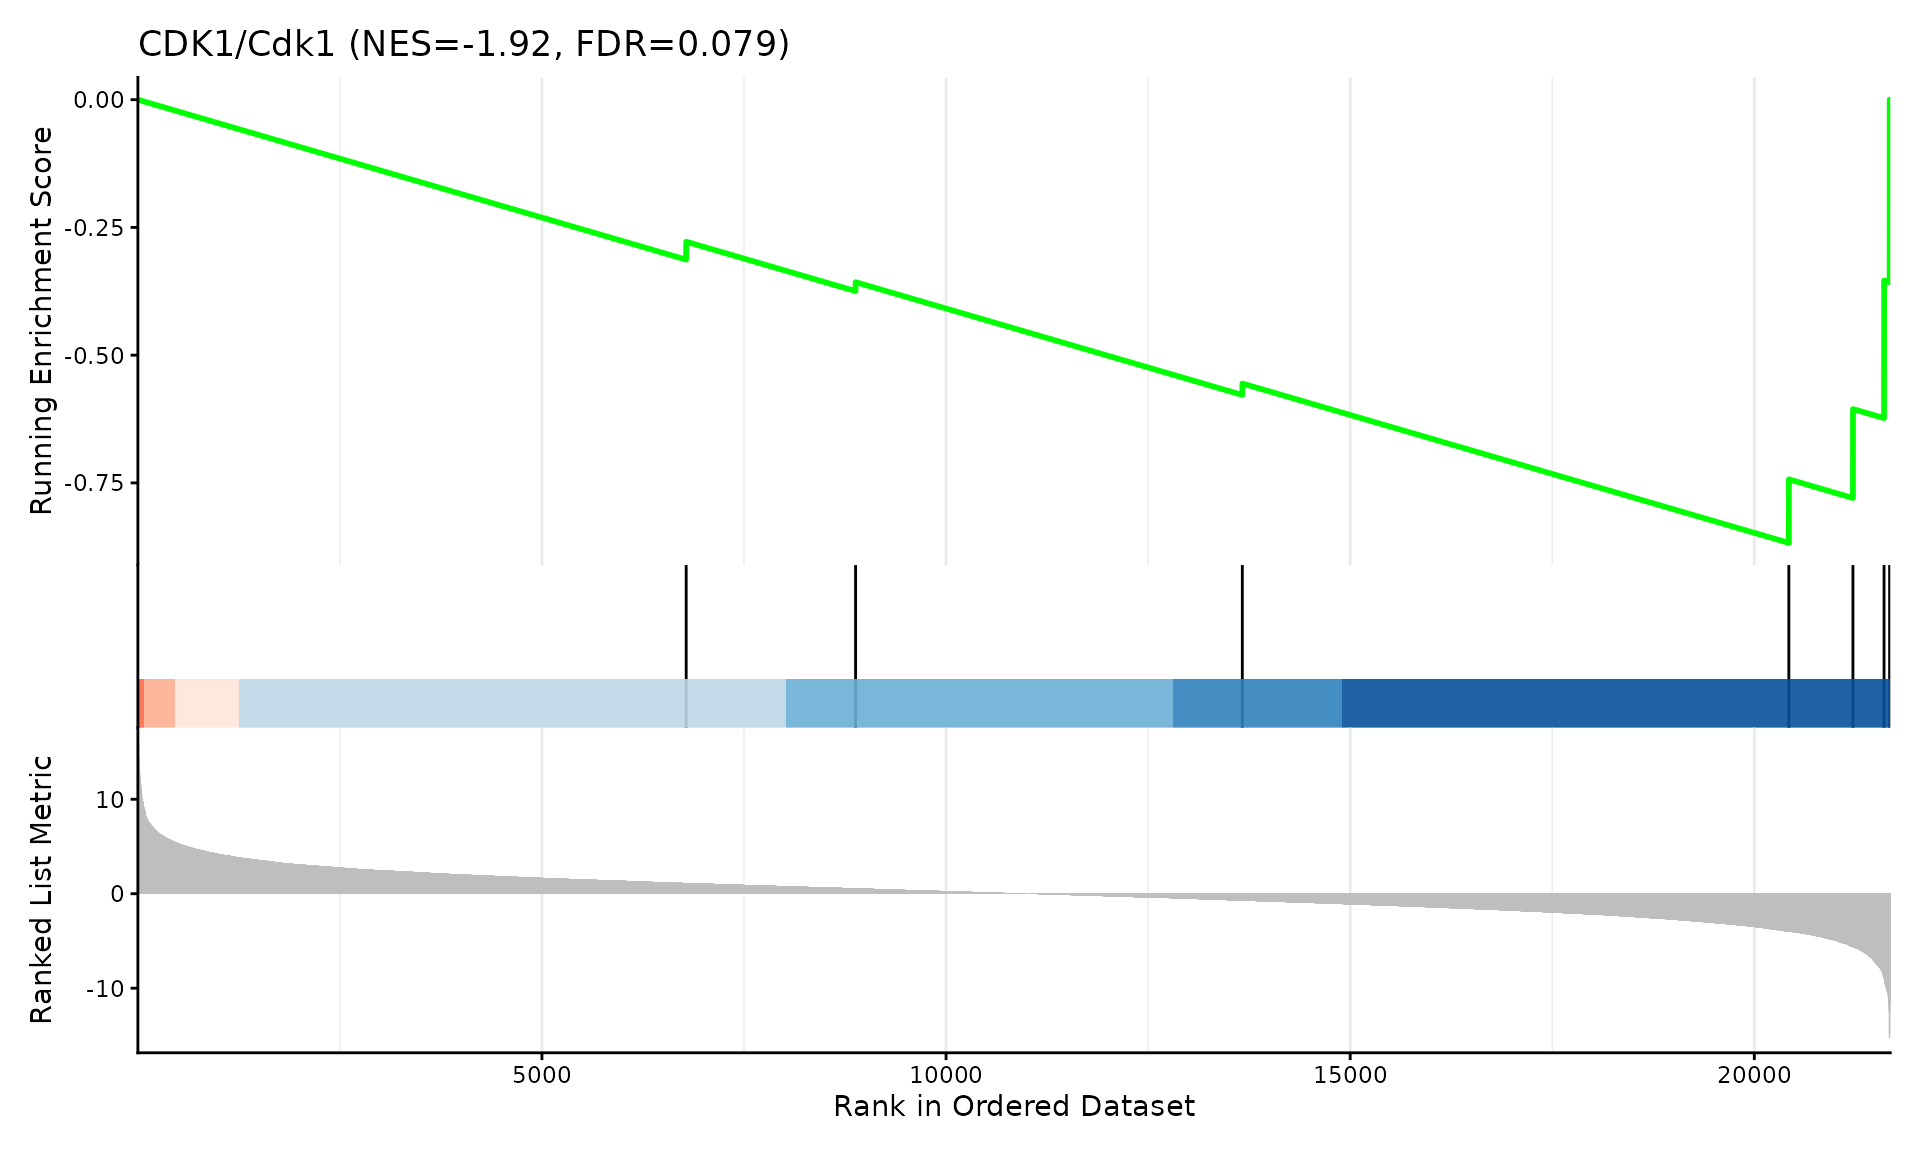
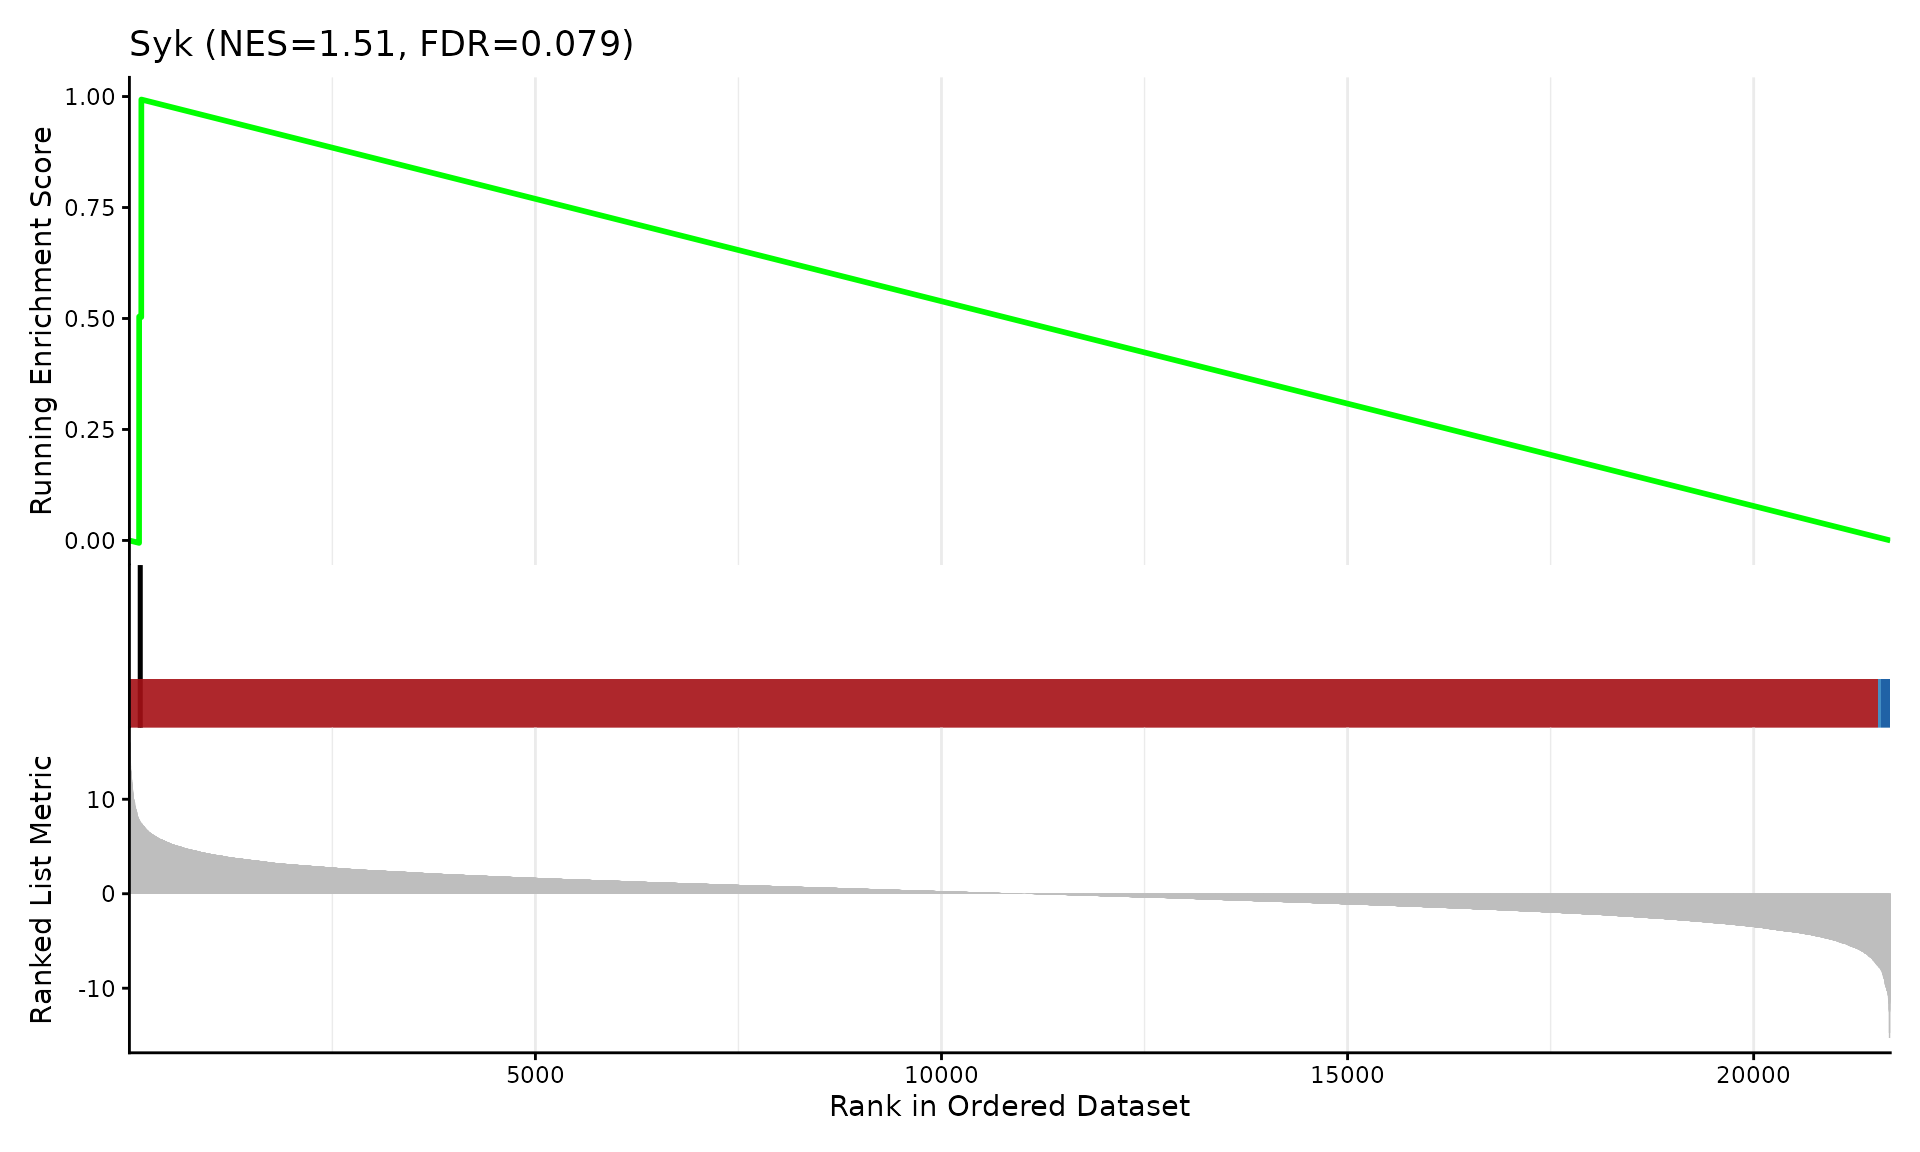
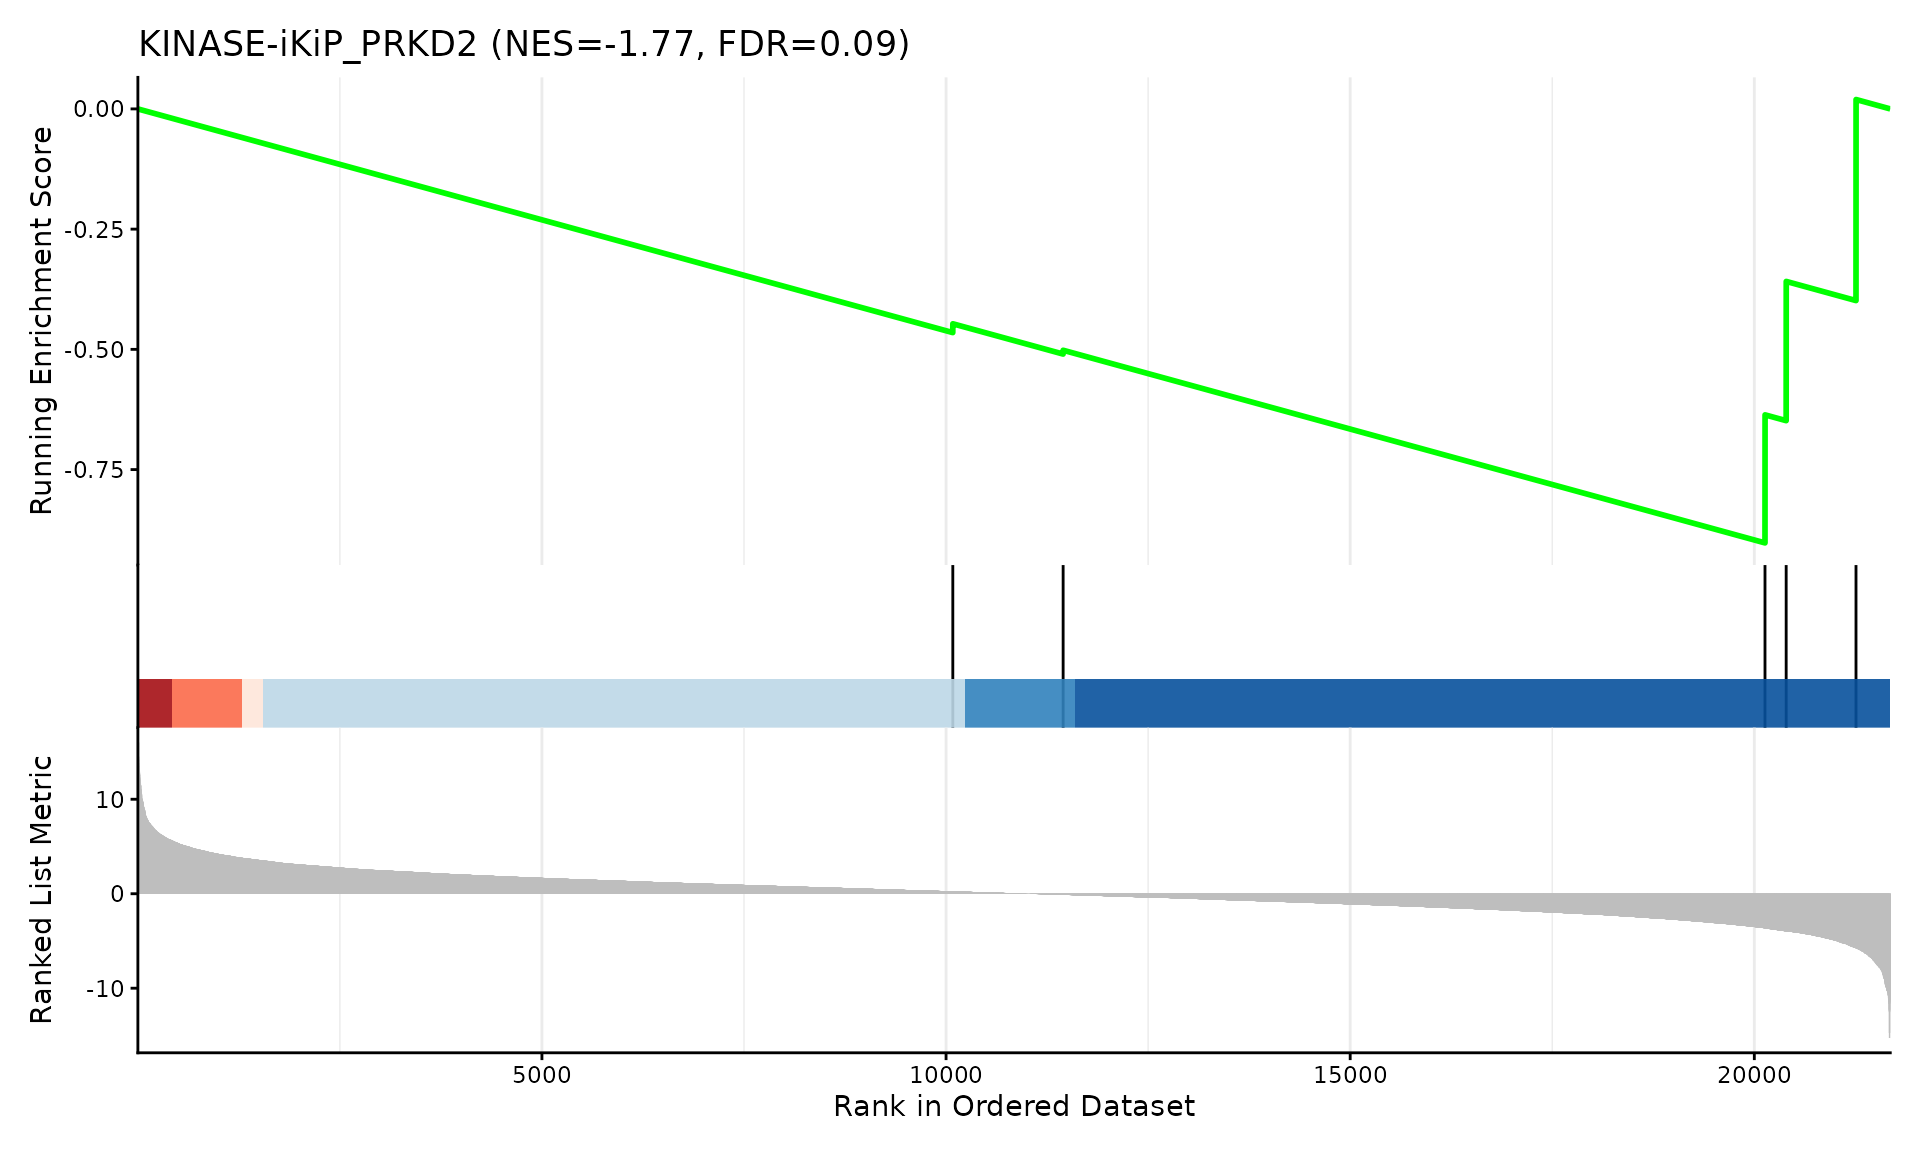
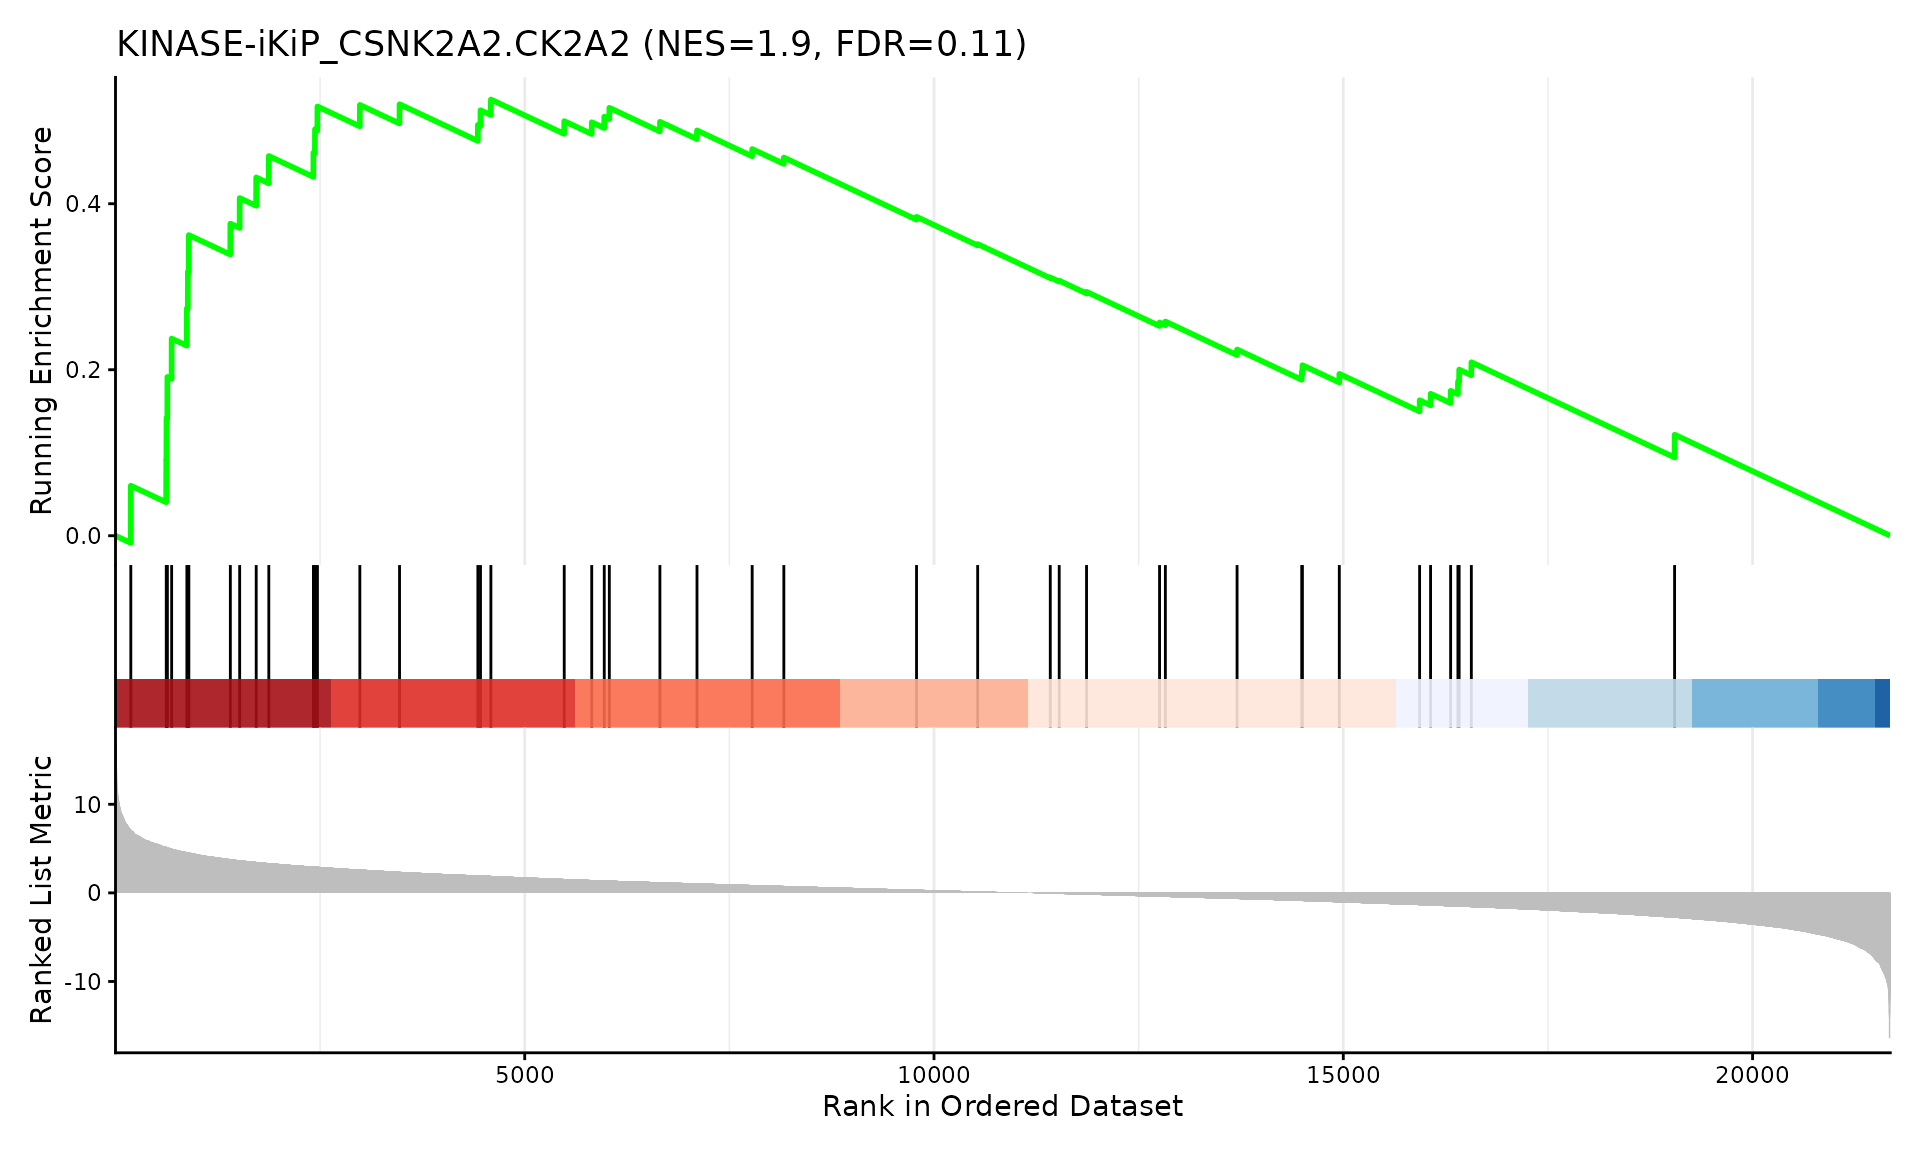
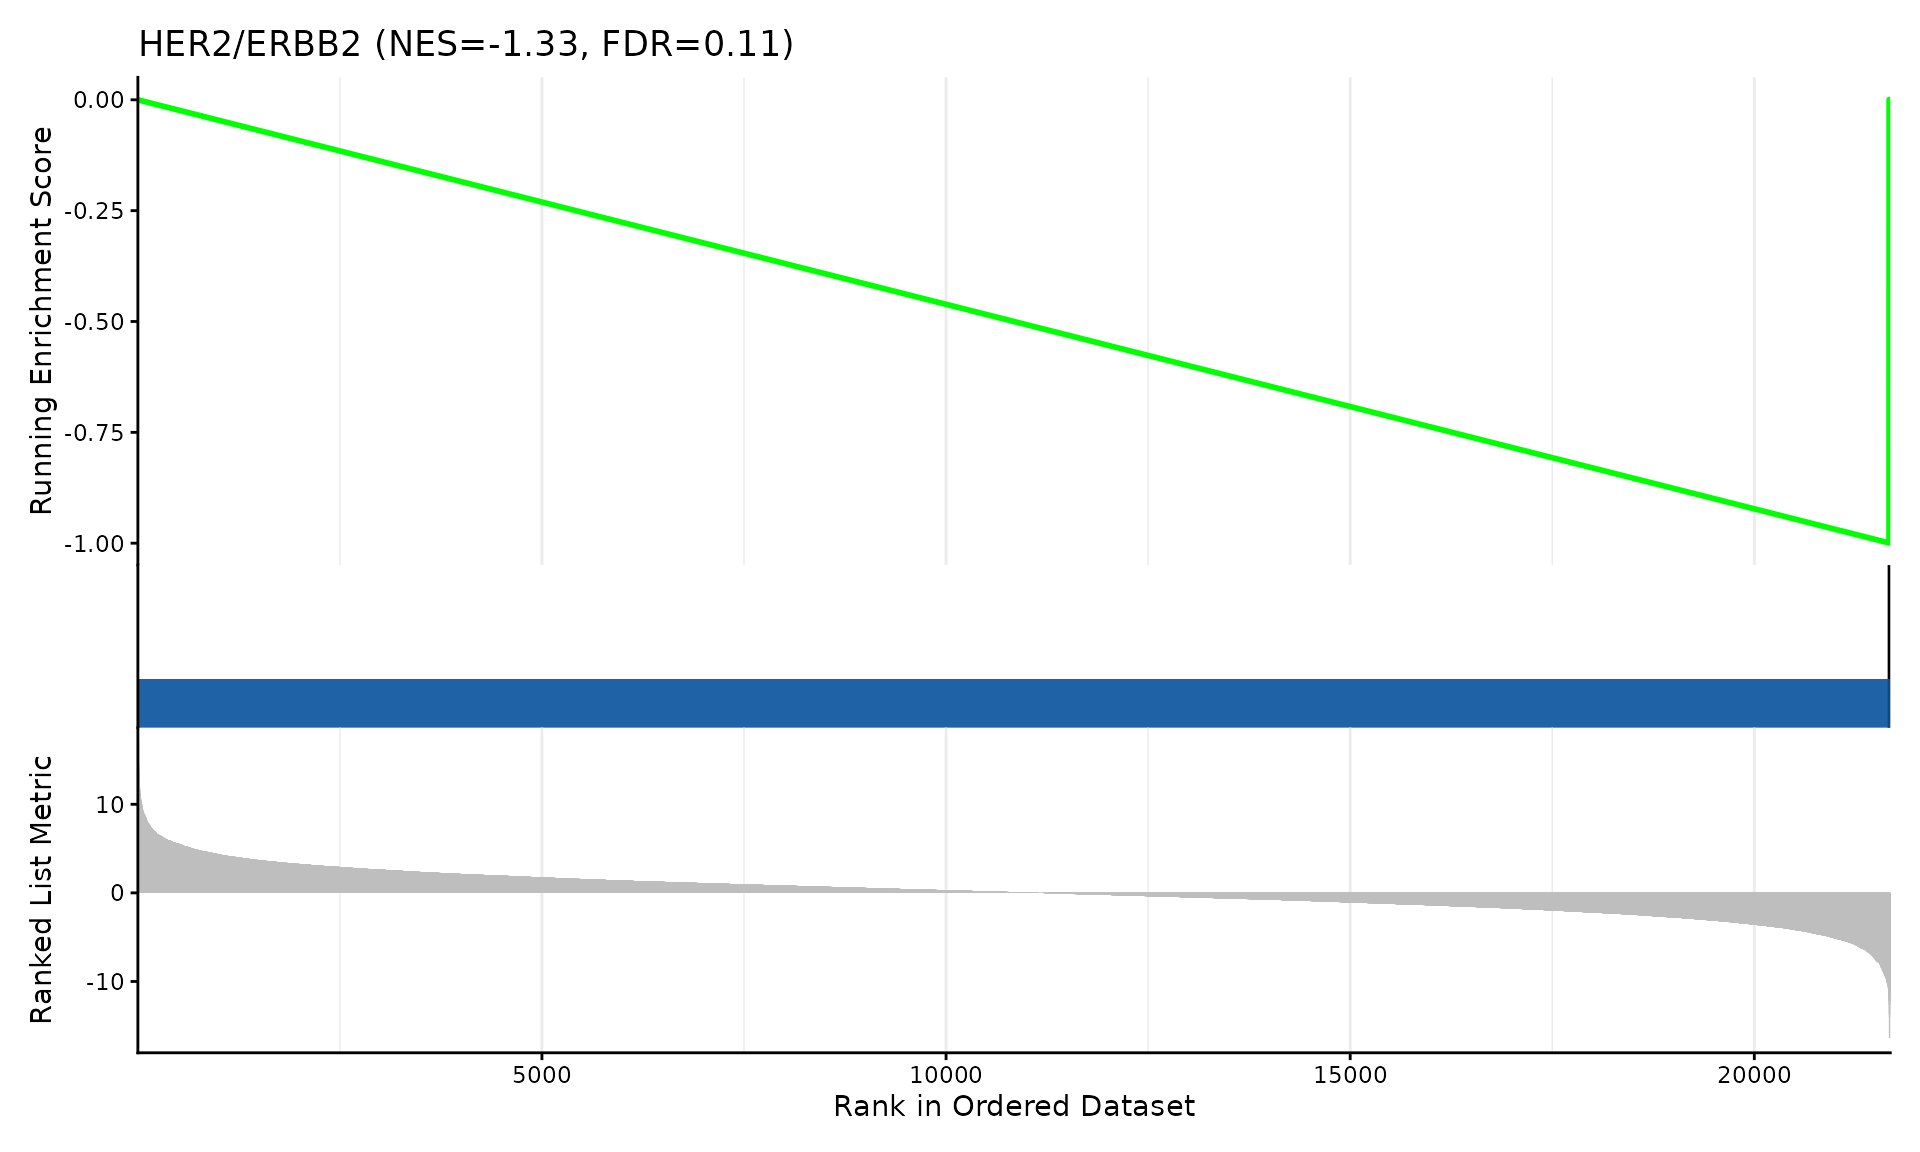
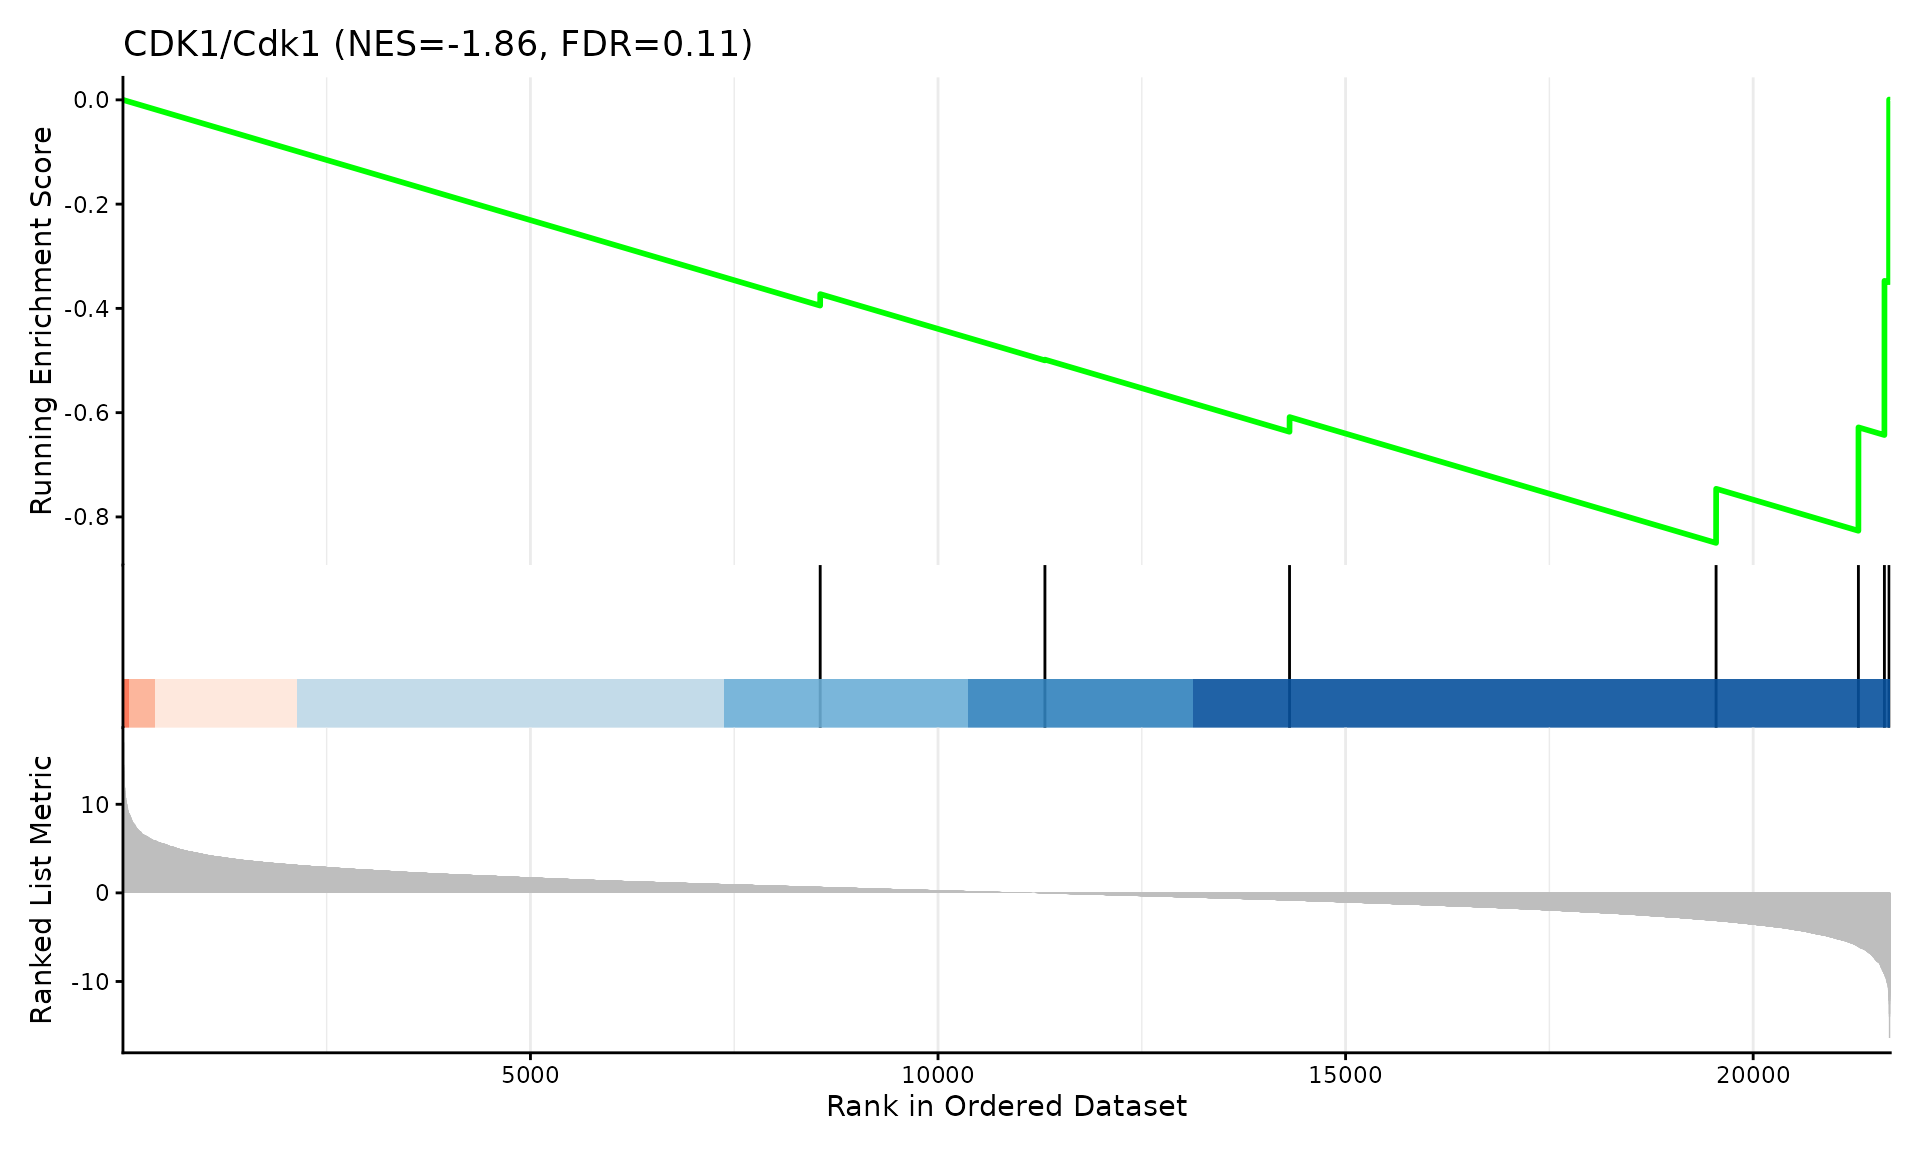
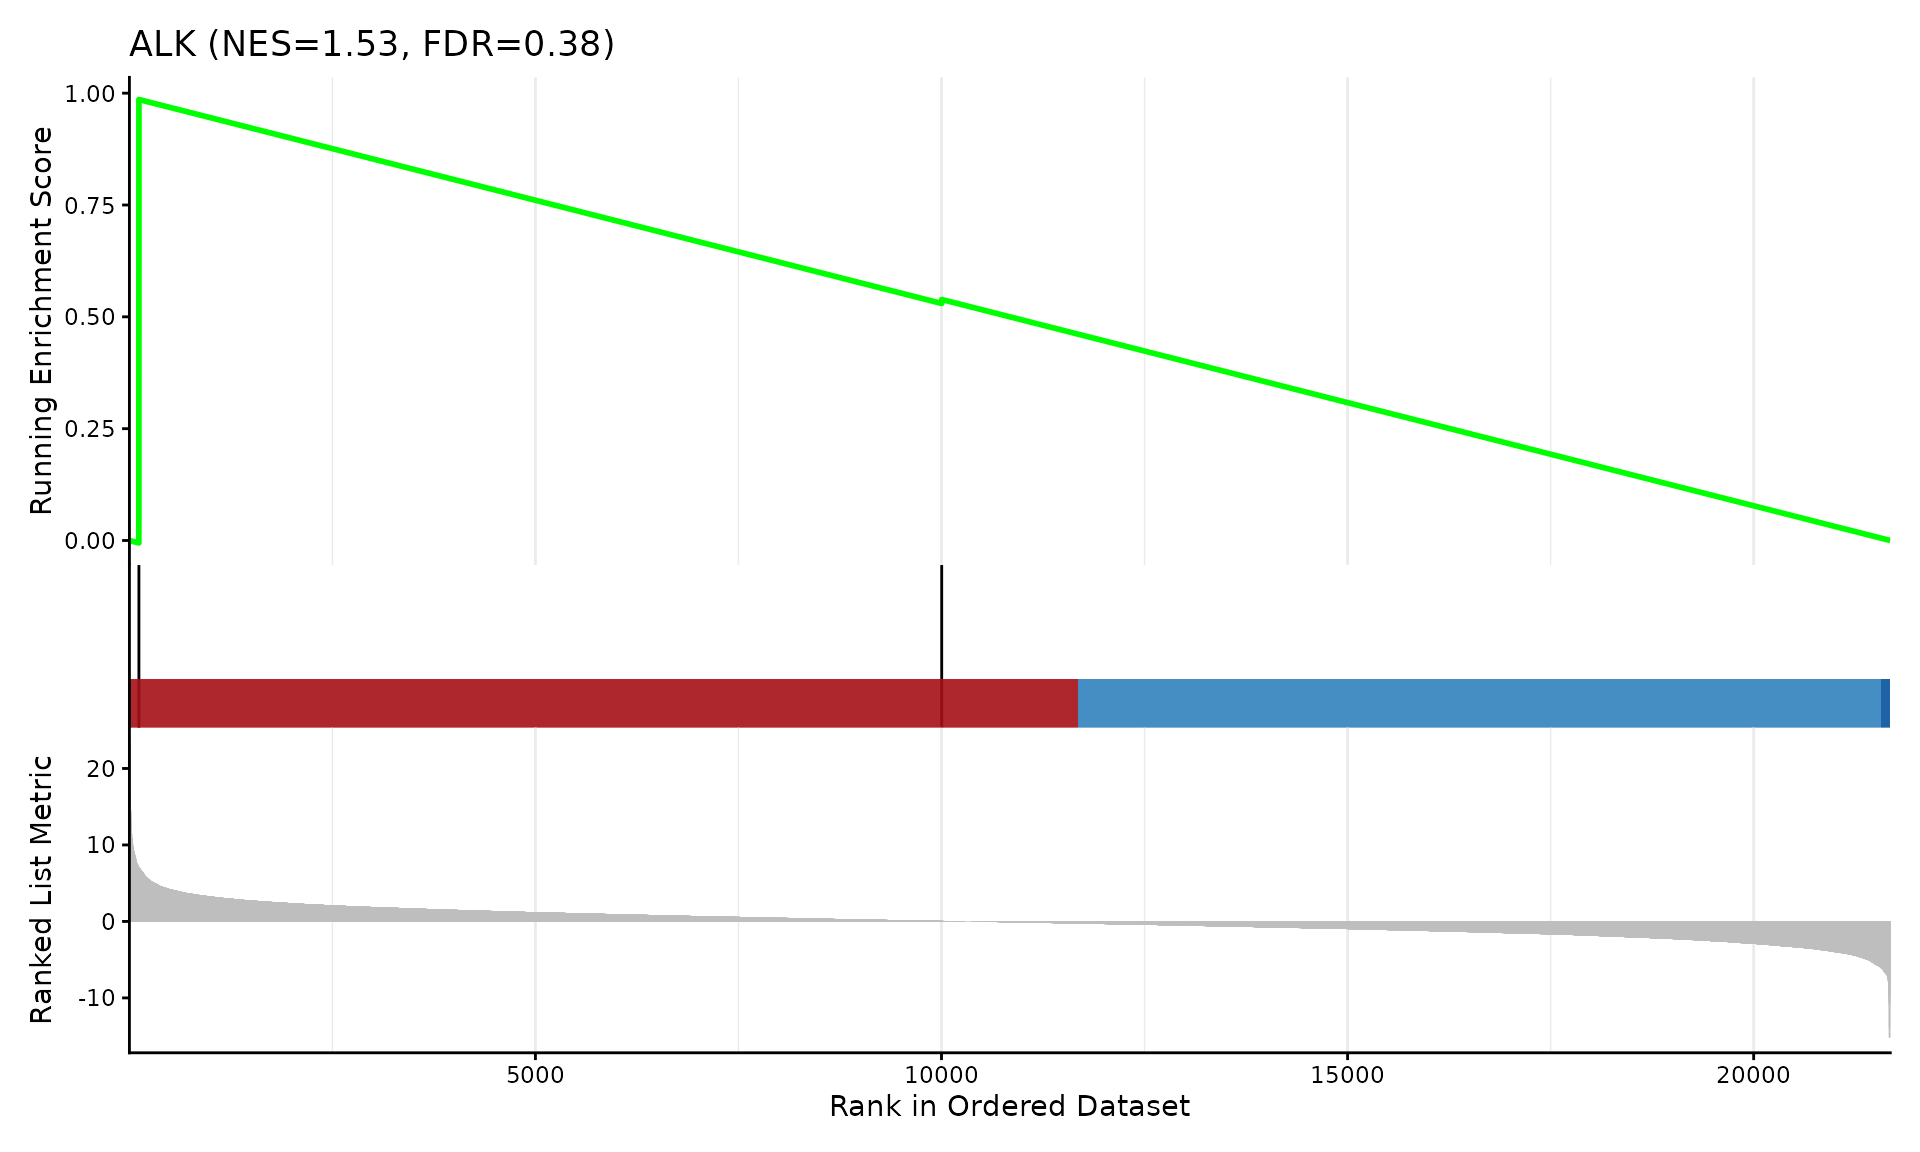
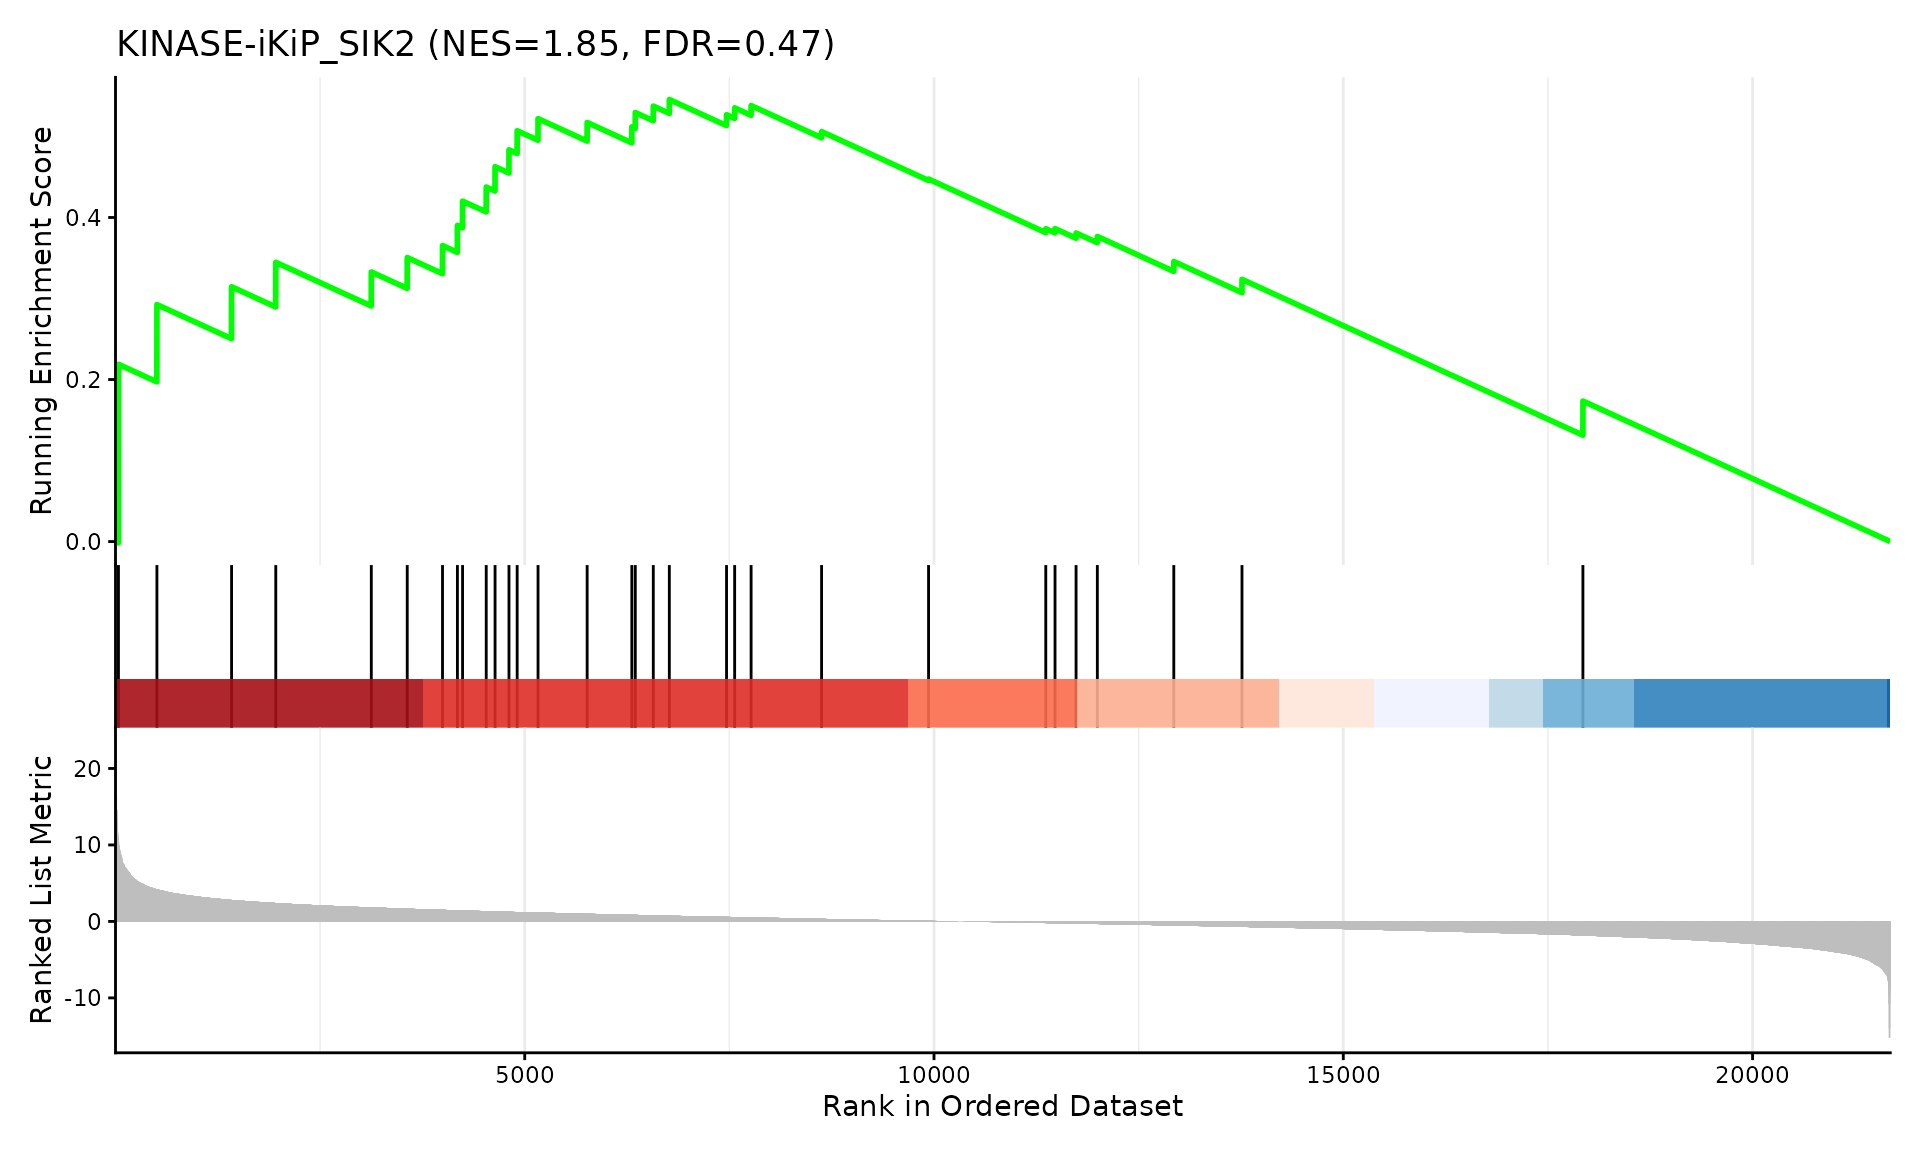
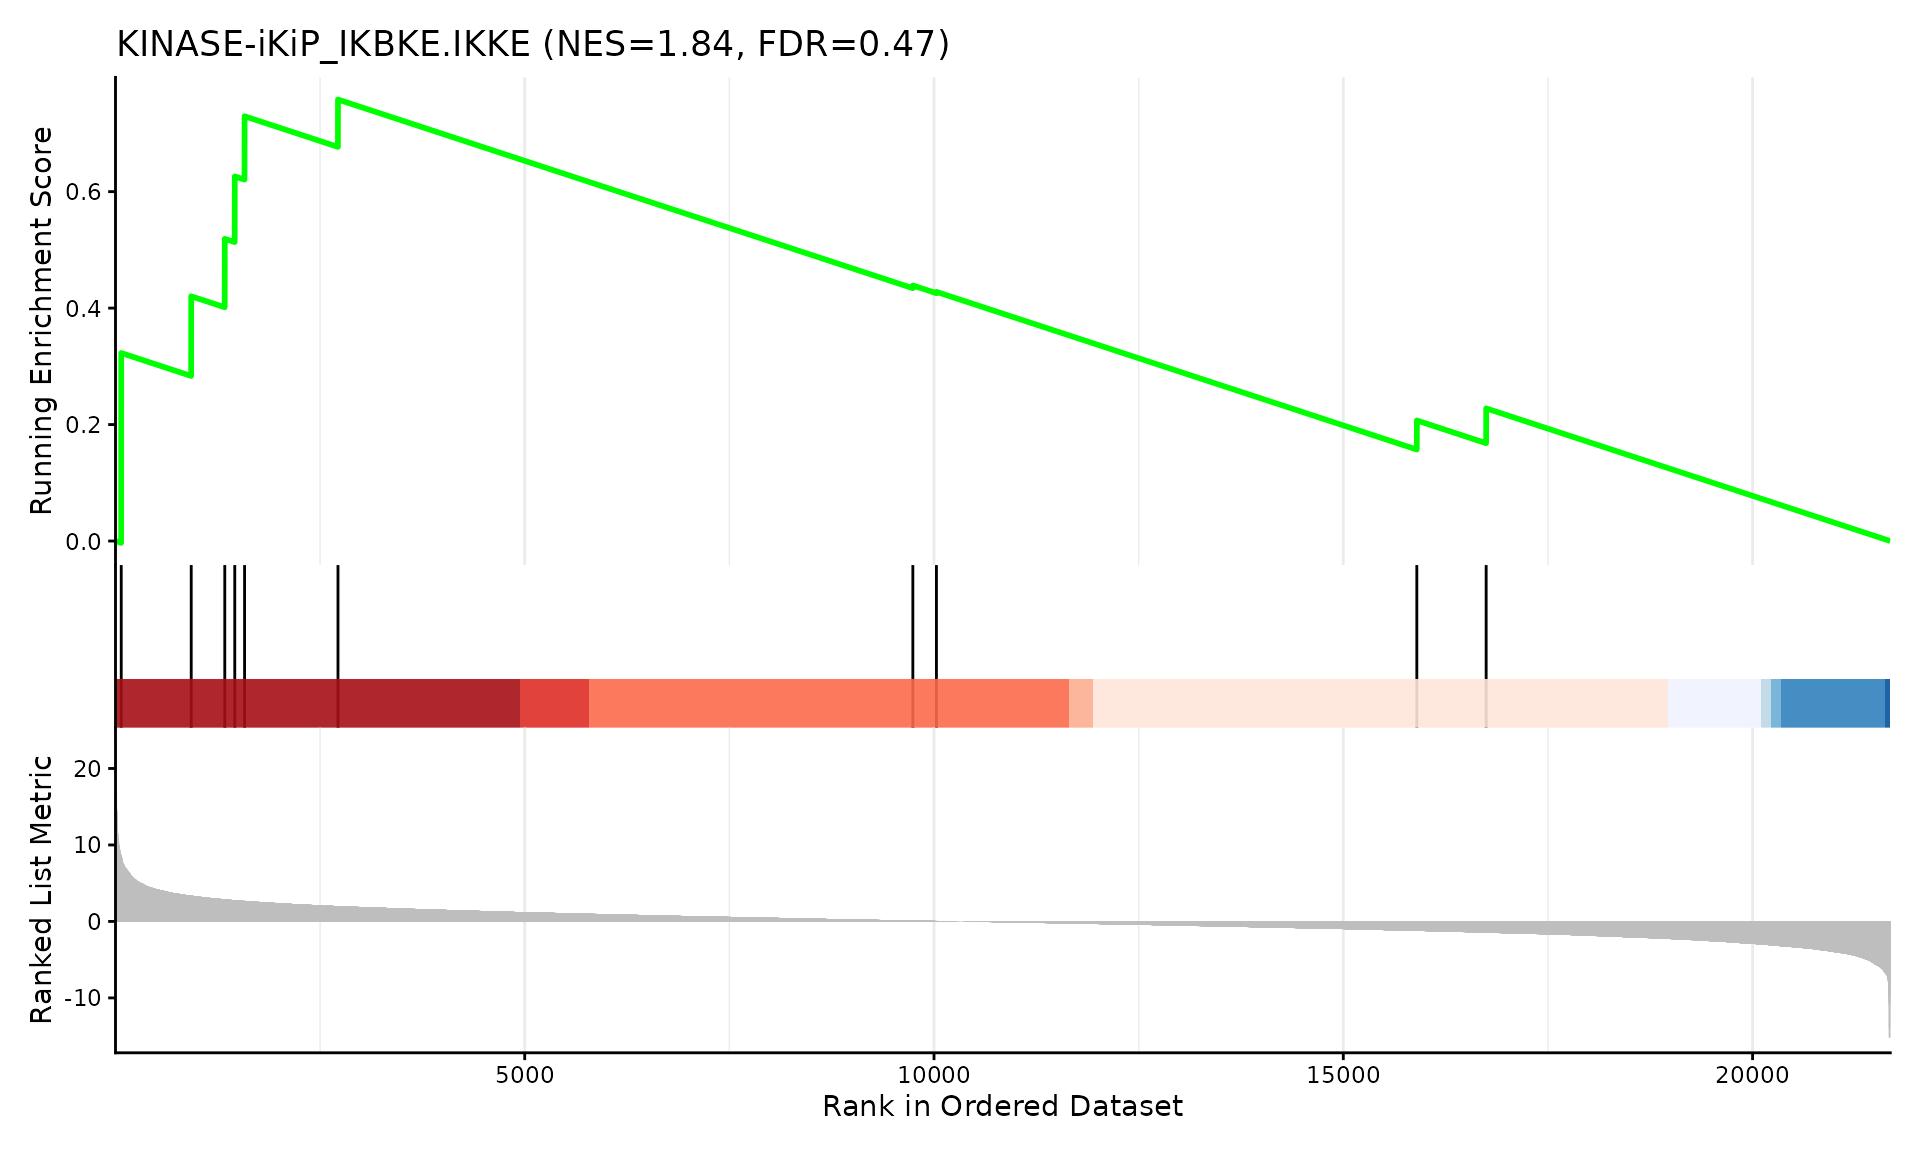
cat("Exported", n_gsea_plots, "GSEA plots to:", pdf_file, "\n")GSEA Enrichment Plots
Showing top 3 plots per contrast.
for (ct in names(results)) {
  cat("\n\n## ", ct, " {.tabset}\n\n")

  res <- results[[ct]]
  top10 <- res@result |>
    as_tibble() |>
    arrange(pvalue) |>
    head(params$top_genesets) |>
    pull(ID)

  for (i in seq_along(top10)) {
    geneset <- top10[i]
    pathway_short <- gsub("^(KINASE|PERT|PATH|DISEASE)-PSP_", "", geneset)
    cat("\n\n### ", pathway_short, "\n\n")

    row <- res@result |>
      as_tibble() |>
      filter(ID == geneset)
    nes_val <- round(row$NES, 2)
    fdr <- signif(row$p.adjust, 2)

    p <- gseaplot2(res,
      geneSetID = geneset,
      title = paste0(pathway_short, " (NES=", nes_val, ", FDR=", fdr, ")")
    )
    print(p)
    cat("\n\n")
  }
}
All Results
# All pathways across all contrasts
all_clean_dt <- all_clean |>
  select(contrast, pathway = ID, NES, pvalue, FDR = p.adjust, setSize) |>
  arrange(contrast, FDR) |>
  mutate(across(where(is.numeric), ~ round(.x, 4)))

DT::datatable(all_clean_dt,
  filter = "top",
  extensions = "Buttons",
  options = list(
    pageLength = 15, scrollX = TRUE,
    dom = "Bfrtip", buttons = c("copy", "csv", "excel")
  ),
  caption = "All pathways across all contrasts"
)
Export Results
# Create output directory
dir.create(output_dir, recursive = TRUE, showWarnings = FALSE)

# Prepare export data
export_data <- all_clean |> arrange(contrast, pvalue)

export_list <- list(all_clean = export_data)

# Add per-contrast sheets
for (ct in unique(export_data$contrast)) {
  sheet_name <- gsub("[^a-zA-Z0-9_]", "_", substr(ct, 1, 31))
  export_list[[sheet_name]] <- export_data |> filter(contrast == ct)
}

# Add significant results sheet
export_list[["significant_FDR10"]] <- export_data |> filter(p.adjust < 0.1)

# Write Excel
xlsx_file <- file.path(output_dir, paste0("PTMSEA_", params$analysis_type, "_results.xlsx"))
writexl::write_xlsx(export_list, xlsx_file)

# Save RDS with full results objects
rds_file <- file.path(output_dir, paste0("PTMSEA_", params$analysis_type, "_results.rds"))
saveRDS(results, rds_file)

# Export summary
export_summary <- tibble(
  Output = c("Excel results", "RDS object"),
  File = c(xlsx_file, rds_file),
  Size = c(
    paste(round(file.size(xlsx_file) / 1024, 1), "KB"),
    paste(round(file.size(rds_file) / 1024, 1), "KB")
  )
)
knitr::kable(export_summary, caption = "Exported Files")
message("Vignette mode: File export skipped.")Session Info
## R version 4.6.1 (2026-06-24)
## Platform: x86_64-pc-linux-gnu
## Running under: Ubuntu 24.04.4 LTS
##
## Matrix products: default
## BLAS:   /usr/lib/x86_64-linux-gnu/openblas-pthread/libblas.so.3
## LAPACK: /usr/lib/x86_64-linux-gnu/openblas-pthread/libopenblasp-r0.3.26.so;  LAPACK version 3.12.0
##
## locale:
##  [1] LC_CTYPE=C.UTF-8       LC_NUMERIC=C           LC_TIME=C.UTF-8
##  [4] LC_COLLATE=C.UTF-8     LC_MONETARY=C.UTF-8    LC_MESSAGES=C.UTF-8
##  [7] LC_PAPER=C.UTF-8       LC_NAME=C              LC_ADDRESS=C
## [10] LC_TELEPHONE=C         LC_MEASUREMENT=C.UTF-8 LC_IDENTIFICATION=C
##
## time zone: UTC
## tzcode source: system (glibc)
##
## attached base packages:
## [1] stats     graphics  grDevices utils     datasets  methods   base
##
## other attached packages:
##  [1] ggplot2_4.0.3          writexl_1.5.4          readxl_1.5.0
##  [4] purrr_1.2.2            forcats_1.0.1          fgsea_1.38.0
##  [7] enrichplot_1.32.0      DT_0.34.0              dplyr_1.2.1
## [10] clusterProfiler_4.20.0 prophosqua_0.3.0
##
## loaded via a namespace (and not attached):
##   [1] DBI_1.3.0               gson_0.2.0              httr2_1.3.0
##   [4] rlang_1.3.0             magrittr_2.0.5          DOSE_4.6.0
##   [7] otel_0.2.0              compiler_4.6.1          RSQLite_3.53.3
##  [10] png_0.1-9               systemfonts_1.3.2       callr_3.8.0
##  [13] vctrs_0.7.3             reshape2_1.4.5          stringr_1.6.0
##  [16] pkgconfig_2.0.3         crayon_1.5.3            fastmap_1.2.0
##  [19] XVector_0.52.0          labeling_0.4.3          rmarkdown_2.31
##  [22] ps_1.9.3                ragg_1.5.2              bit_4.6.0
##  [25] xfun_0.60               ggseqlogo_0.2.2         cachem_1.1.0
##  [28] aplot_0.3.1             jsonlite_2.0.0          blob_1.3.0
##  [31] tidydr_0.0.6            BiocParallel_1.46.0     tweenr_2.0.3
##  [34] cluster_2.1.8.2         parallel_4.6.1          R6_2.6.1
##  [37] bslib_0.11.0            stringi_1.8.7           RColorBrewer_1.1-3
##  [40] cellranger_1.1.0        enrichit_0.2.0          jquerylib_0.1.4
##  [43] GOSemSim_2.38.3         Rcpp_1.1.2              Seqinfo_1.2.0
##  [46] bookdown_0.47           knitr_1.51              ggtangle_0.1.2
##  [49] IRanges_2.46.0          splines_4.6.1           Matrix_1.7-5
##  [52] igraph_2.3.3            aisdk_1.4.12            tidyselect_1.2.1
##  [55] qvalue_2.44.0           yaml_2.3.12             codetools_0.2-20
##  [58] processx_3.9.0          lattice_0.22-9          tibble_3.3.1
##  [61] plyr_1.8.9              withr_3.0.3             Biobase_2.72.0
##  [64] treeio_1.36.1           KEGGREST_1.52.2         S7_0.2.2
##  [67] evaluate_1.0.5          gridGraphics_0.5-1      desc_1.4.3
##  [70] polyclip_1.10-7         scatterpie_0.2.6        Biostrings_2.80.1
##  [73] pillar_1.11.1           ggtree_4.2.0            stats4_4.6.1
##  [76] ggfun_0.2.1             generics_0.1.4          S4Vectors_0.50.1
##  [79] scales_1.4.0            tidytree_0.4.8          glue_1.8.1
##  [82] gdtools_0.5.1           lazyeval_0.2.3          tools_4.6.1
##  [85] data.table_1.18.4       ggnewscale_0.5.2        ggiraph_0.9.6
##  [88] fs_2.1.0                fastmatch_1.1-8         cowplot_1.2.0
##  [91] grid_4.6.1              tidyr_1.3.2             ape_5.8-1
##  [94] crosstalk_1.2.2         AnnotationDbi_1.74.0    nlme_3.1-169
##  [97] patchwork_1.3.2         ggforce_0.5.0           cli_3.6.6
## [100] rappdirs_0.3.4          textshaping_1.0.5       fontBitstreamVera_0.1.1
## [103] gtable_0.3.6            yulab.utils_0.2.4       sass_0.4.10
## [106] digest_0.6.39           fontquiver_0.2.1        BiocGenerics_0.58.1
## [109] ggrepel_0.9.8           ggplotify_0.1.3         htmlwidgets_1.6.4
## [112] farver_2.1.2            memoise_2.0.1           htmltools_0.5.9
## [115] pkgdown_2.2.1           lifecycle_1.0.5         httr_1.4.8
## [118] GO.db_3.23.1            fontLiberation_0.1.0    bit64_4.8.2
## [121] MASS_7.3-65