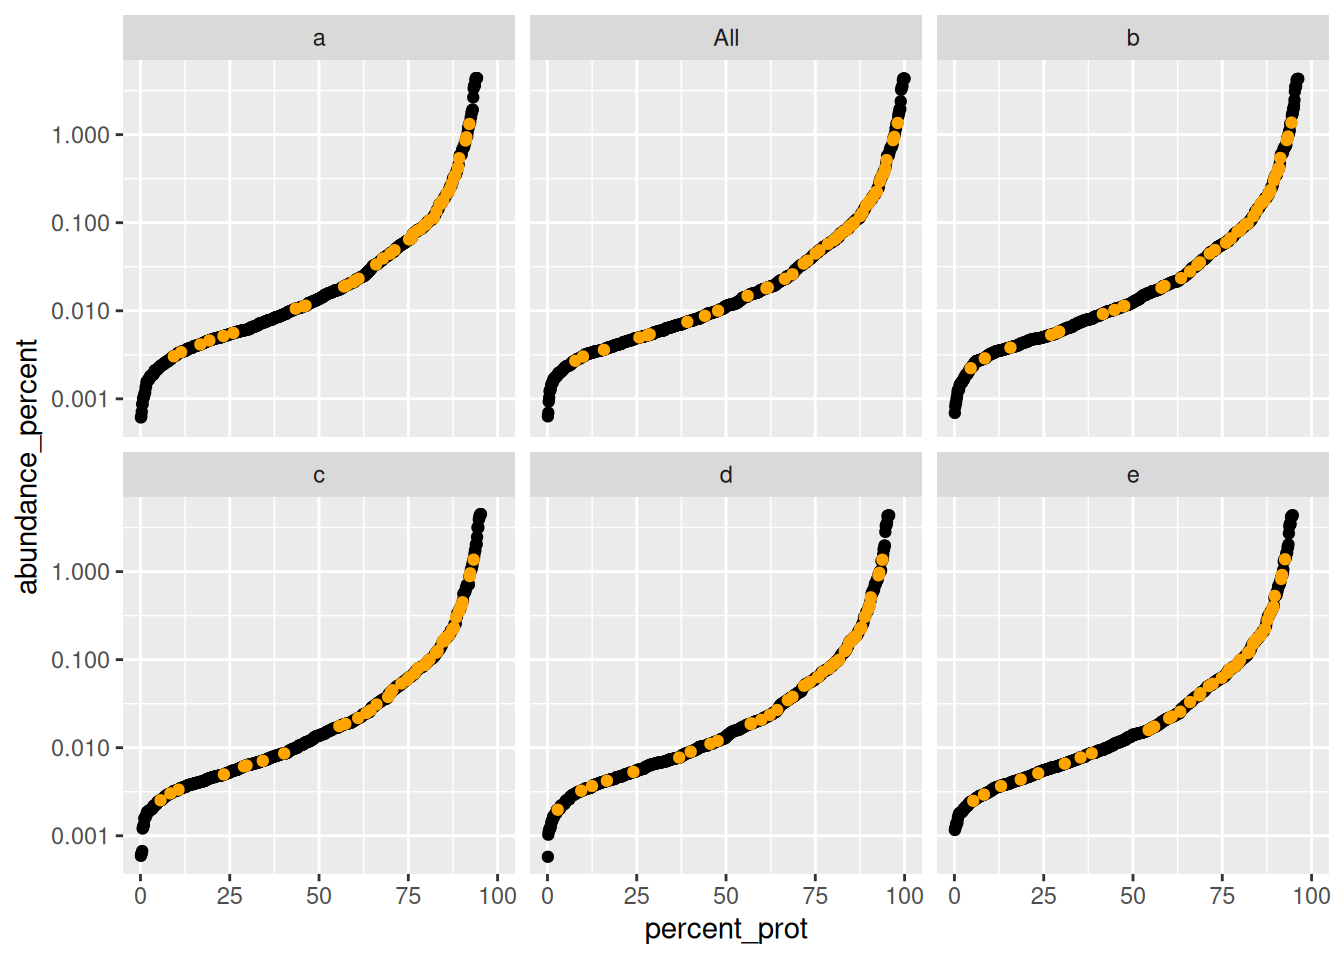
Plot relative protein abundance as a function of rank by abundance

Description

Plot relative protein abundance as a function of rank by abundance

Usage

plot_abundance_vs_percent(
  percInfo,
  cfg_config,
  top_N = 10,
  factors = TRUE,
  colors = c(`^REV_` = "red", `^CON_` = "orange"),
  columnAb = "abundance_percent",
  group = "BB",
  alpha = 1,
  highlight_alpha = 1,
  logY = TRUE
)

Arguments

percInfo data frame with percentage abundance info
cfg_config AnalysisConfiguration object
top_N number of top proteins to label
factors if TRUE facet by factors
colors named vector of colors for special proteins
columnAb column name for abundance values
group crosstalk group identifier
alpha point transparency for regular (black) proteins
highlight_alpha point transparency for highlighted (coloured) proteins
logY if TRUE use log10 y-axis

Value

ggplot2

Examples

library("prolfquapp")


library(prolfqua)
istar <- prolfqua::prolfqua_data('data_ionstar')$filtered()
data <- istar$data |> dplyr::filter(protein_Id %in% sample(protein_Id, 100))
lfqdata <- prolfqua::LFQData$new(data, istar$config)
sr <- lfqdata$get_Summariser()
undebug(plot_abundance_vs_percent)
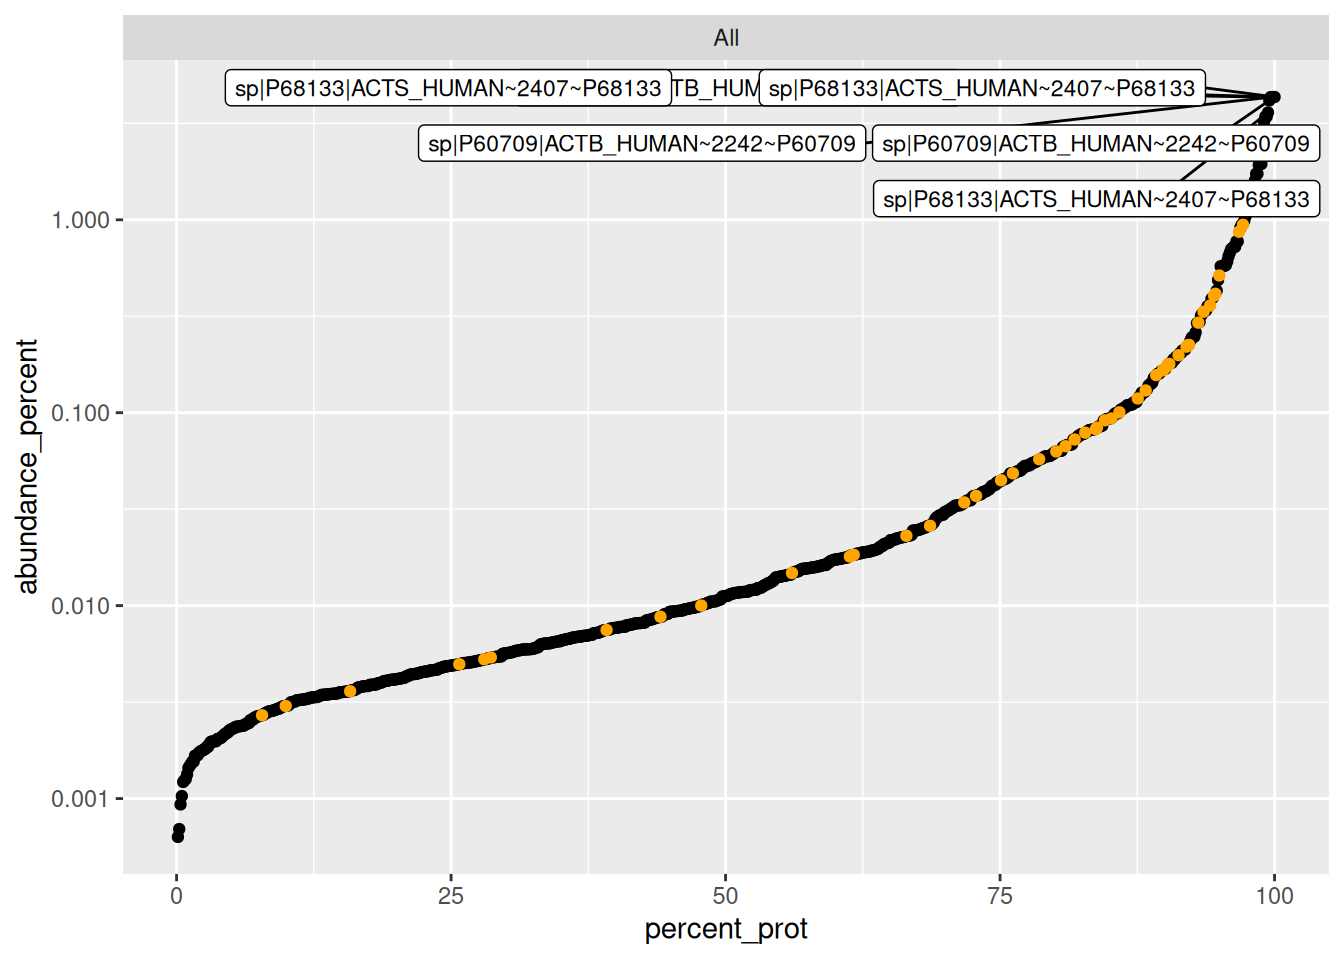
plot_abundance_vs_percent(sr$percentage_abundance(),
 lfqdata$get_config(),
 top_N = 6, factors = FALSE, logY = TRUE)
pd <- plot_abundance_vs_percent(
  sr$percentage_abundance(),
  lfqdata$get_config(), top_N = NULL, factors = FALSE)
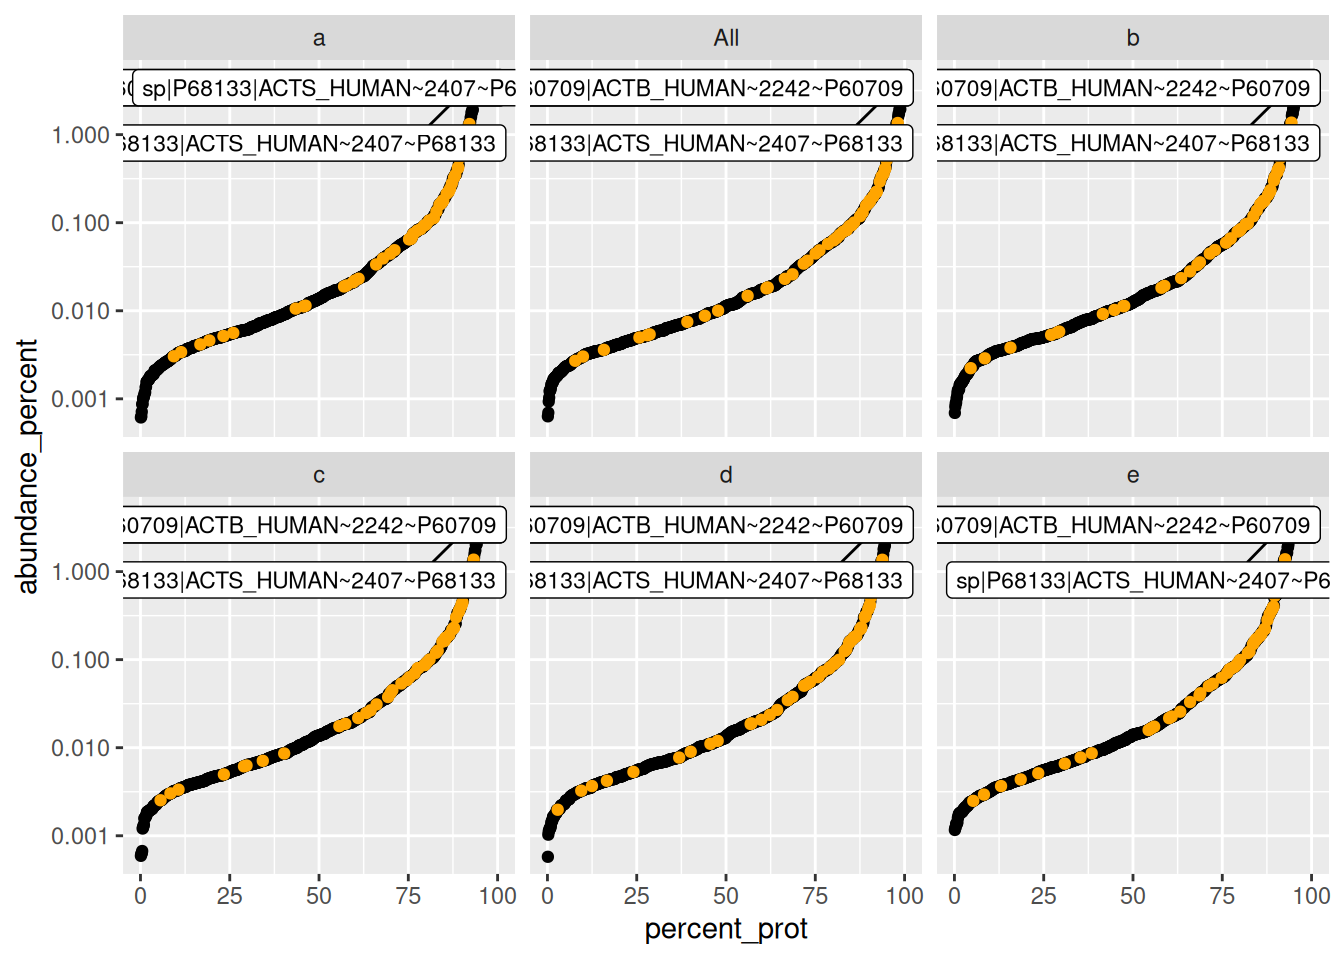
plot_abundance_vs_percent(
  sr$percentage_abundance(),
  lfqdata$get_config(), top_N = 4, factors = TRUE)
plot_abundance_vs_percent(
  sr$percentage_abundance(),
  lfqdata$get_config(), top_N = NULL, factors = TRUE)