DEA benchmark IonStar/FragPipeV14/combined_protein.tsv
Witold E. Wolski
2026-02-25
Source:vignettes/BenchmarkFragPipeProteinIonStar.Rmd
BenchmarkFragPipeProteinIonStar.RmdPlease download and install the prolfquadata package
from github
conflicted::conflict_prefer("filter", "dplyr")Load data
We start by loading the IonStar dataset and the annotation from the
prolfquadata package. The method inner_join
adds the annotation to the data.
datadir <- file.path(find.package("prolfquadata") , "quantdata")
inputFragfile <-  file.path(datadir, "MSFragger_IonStar2018_PXD003881.zip")
inputAnnotation <- file.path(datadir, "annotation_Ionstar2018_PXD003881.xlsx")
annotation <- readxl::read_xlsx(inputAnnotation)

protein <- tibble::as_tibble(read.csv(unz(inputFragfile,"IonstarWithMSFragger/combined_protein.tsv"),
                                      header = TRUE, sep = "\t", stringsAsFactors = FALSE))

undebug( prolfquapp::tidy_FragPipe_combined_protein)
protein <- prolfquapp::tidy_FragPipe_combined_protein_deprec(protein)
protein <- protein |> dplyr::filter(unique.stripped.peptides > 1)
merged <- dplyr::inner_join(annotation, protein)
Create prolfqua configuration
atable <- prolfqua::AnalysisConfiguration$new()
atable$fileName = "raw.file"
atable$hierarchy[["protein_Id"]] <- c("protein")

atable$hierarchyDepth <- 1
atable$set_response("razor.intensity")
atable$factors[["dilution."]] = "sample"
atable$factors[["run"]] = "run_ID"
atable$factorDepth <- 1


config <- prolfqua::AnalysisConfiguration$new(atable)

adata <- prolfqua::setup_analysis(merged, config)
lfqdata <- prolfqua::LFQData$new(adata, config)
lfqdata$remove_small_intensities()
Normalize data using human proteins
pl <- lfqdata$get_Plotter()
pl$intensity_distribution_density()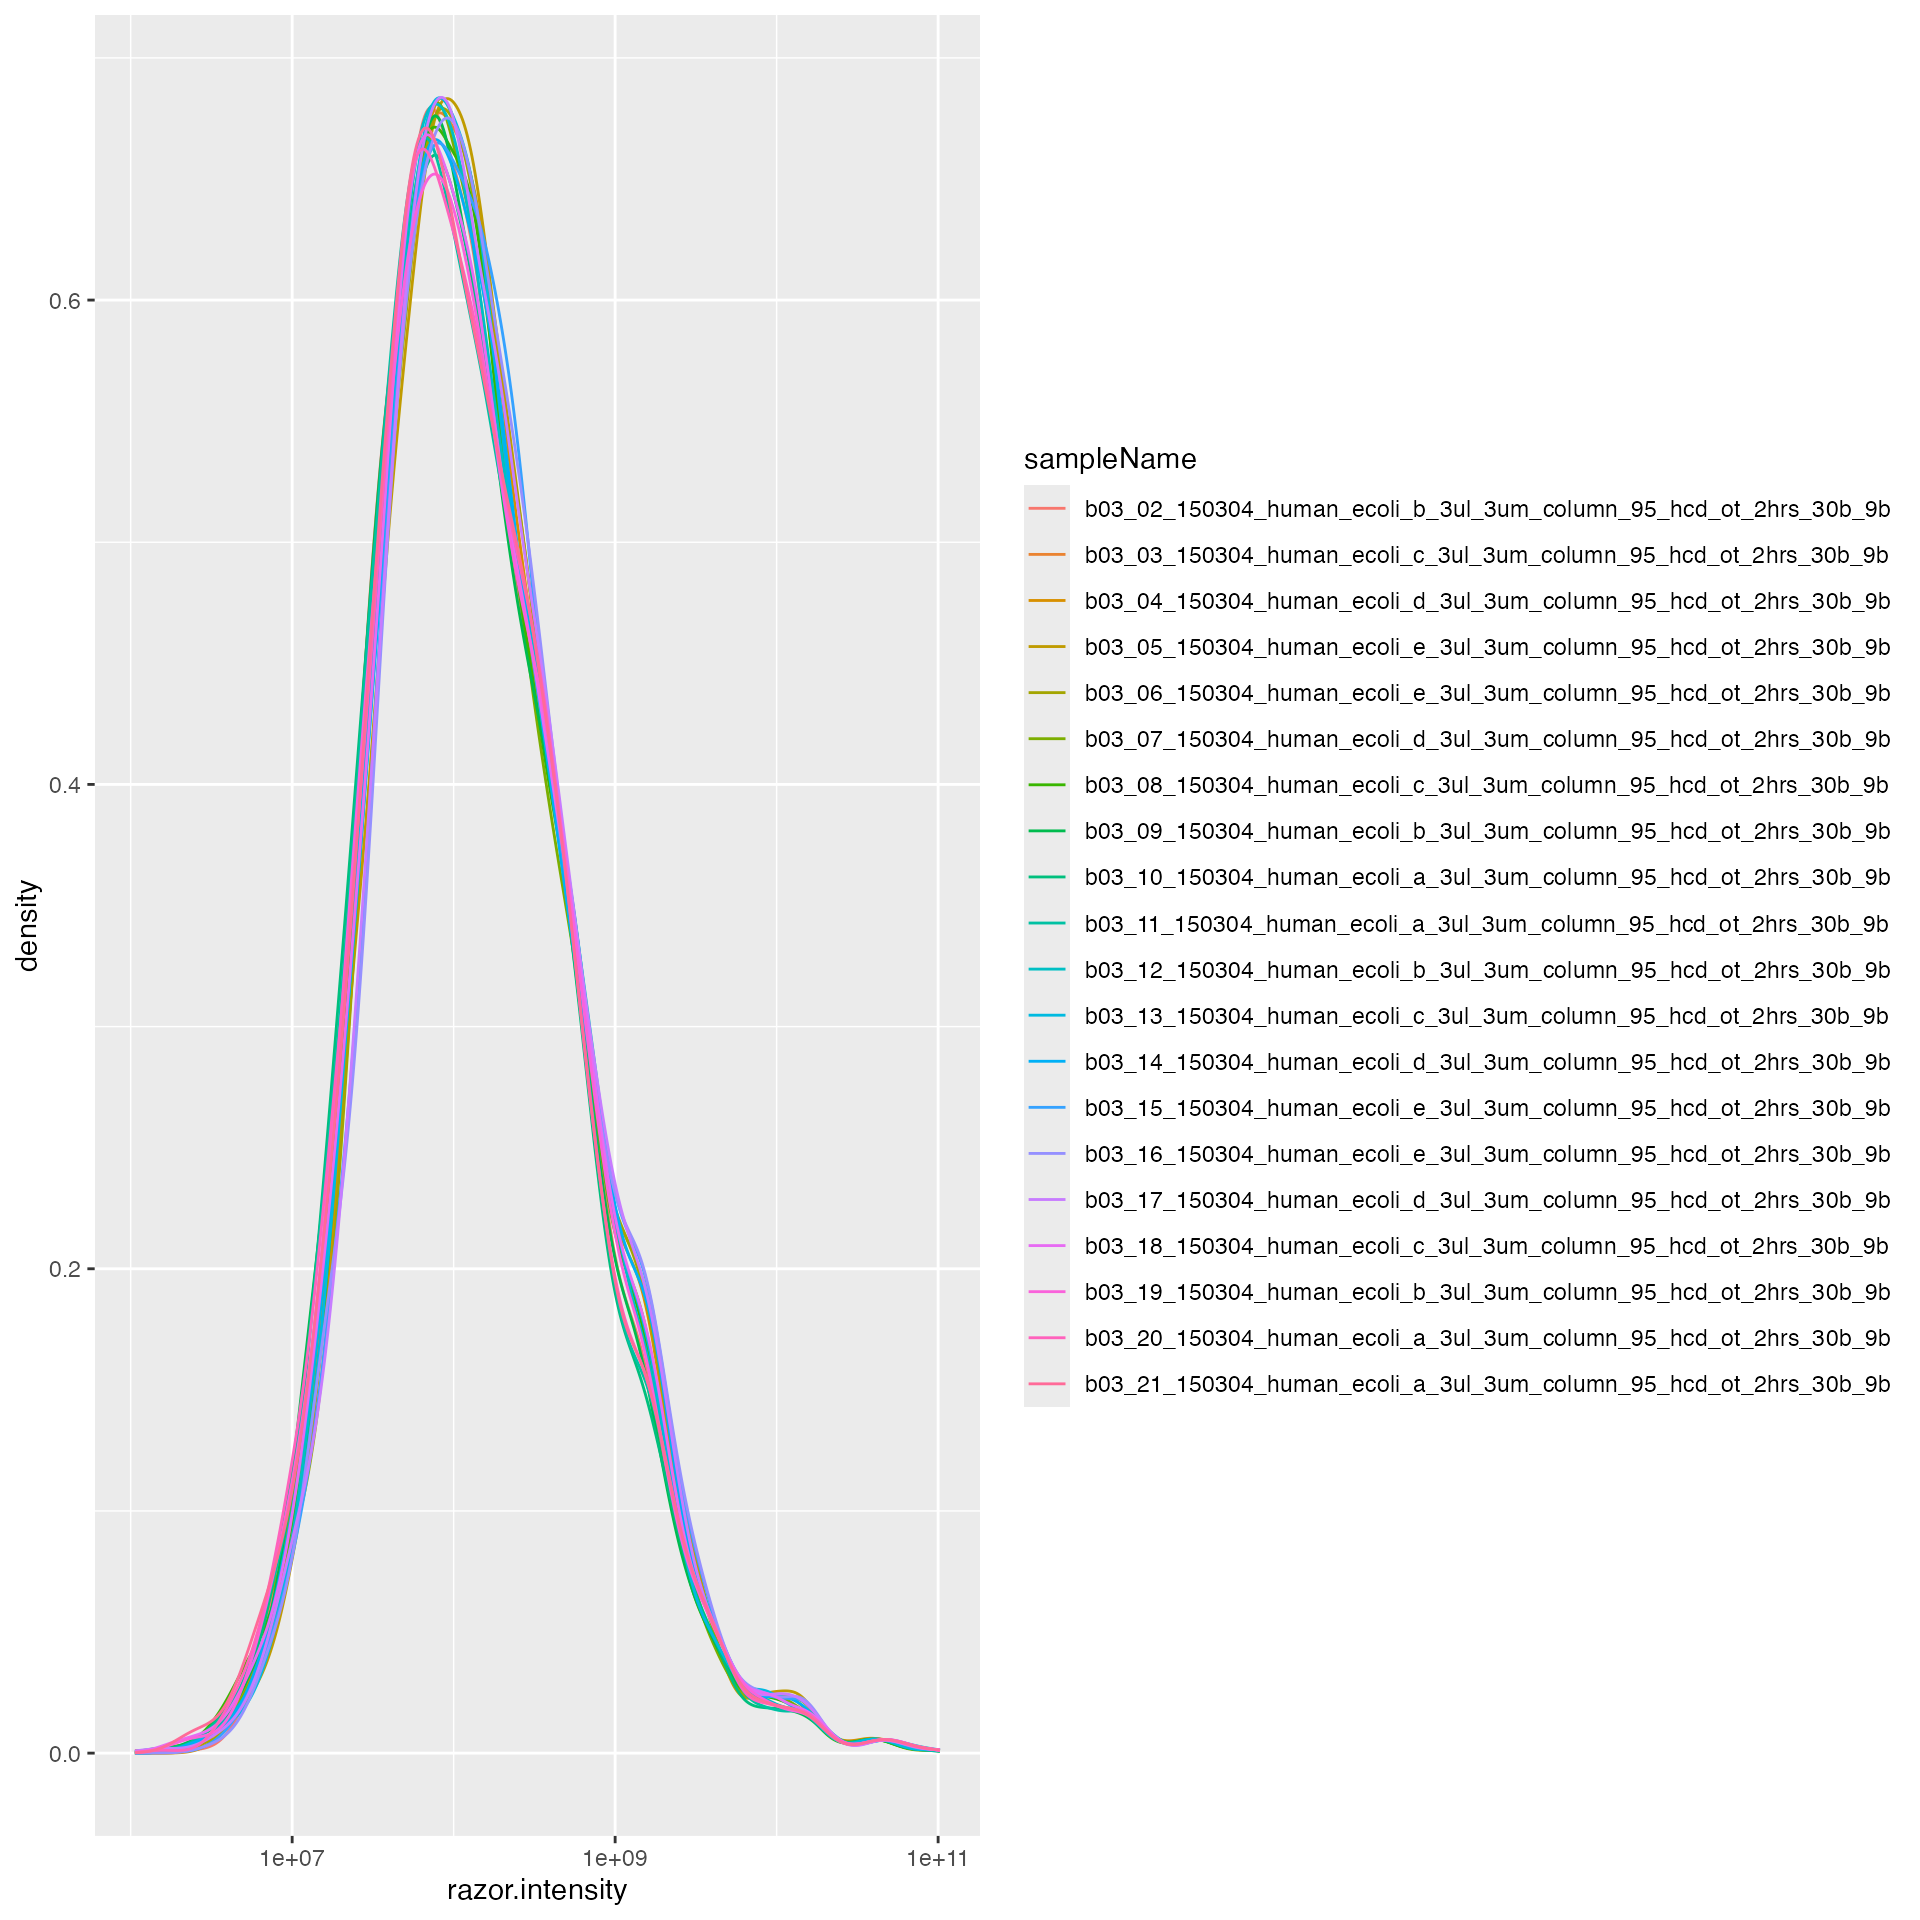
subset_h <- lfqdata$get_copy()$get_Transformer()$log2()$lfq
subset_h$data <- subset_h$data |> dplyr::filter(grepl("HUMAN", protein_Id))
tr <- lfqdata$get_Transformer()
lfqdataNormalized <- tr$log2()$robscale_subset(lfqsubset = subset_h)$lfq
pl <- lfqdataNormalized$get_Plotter()
pl$intensity_distribution_density()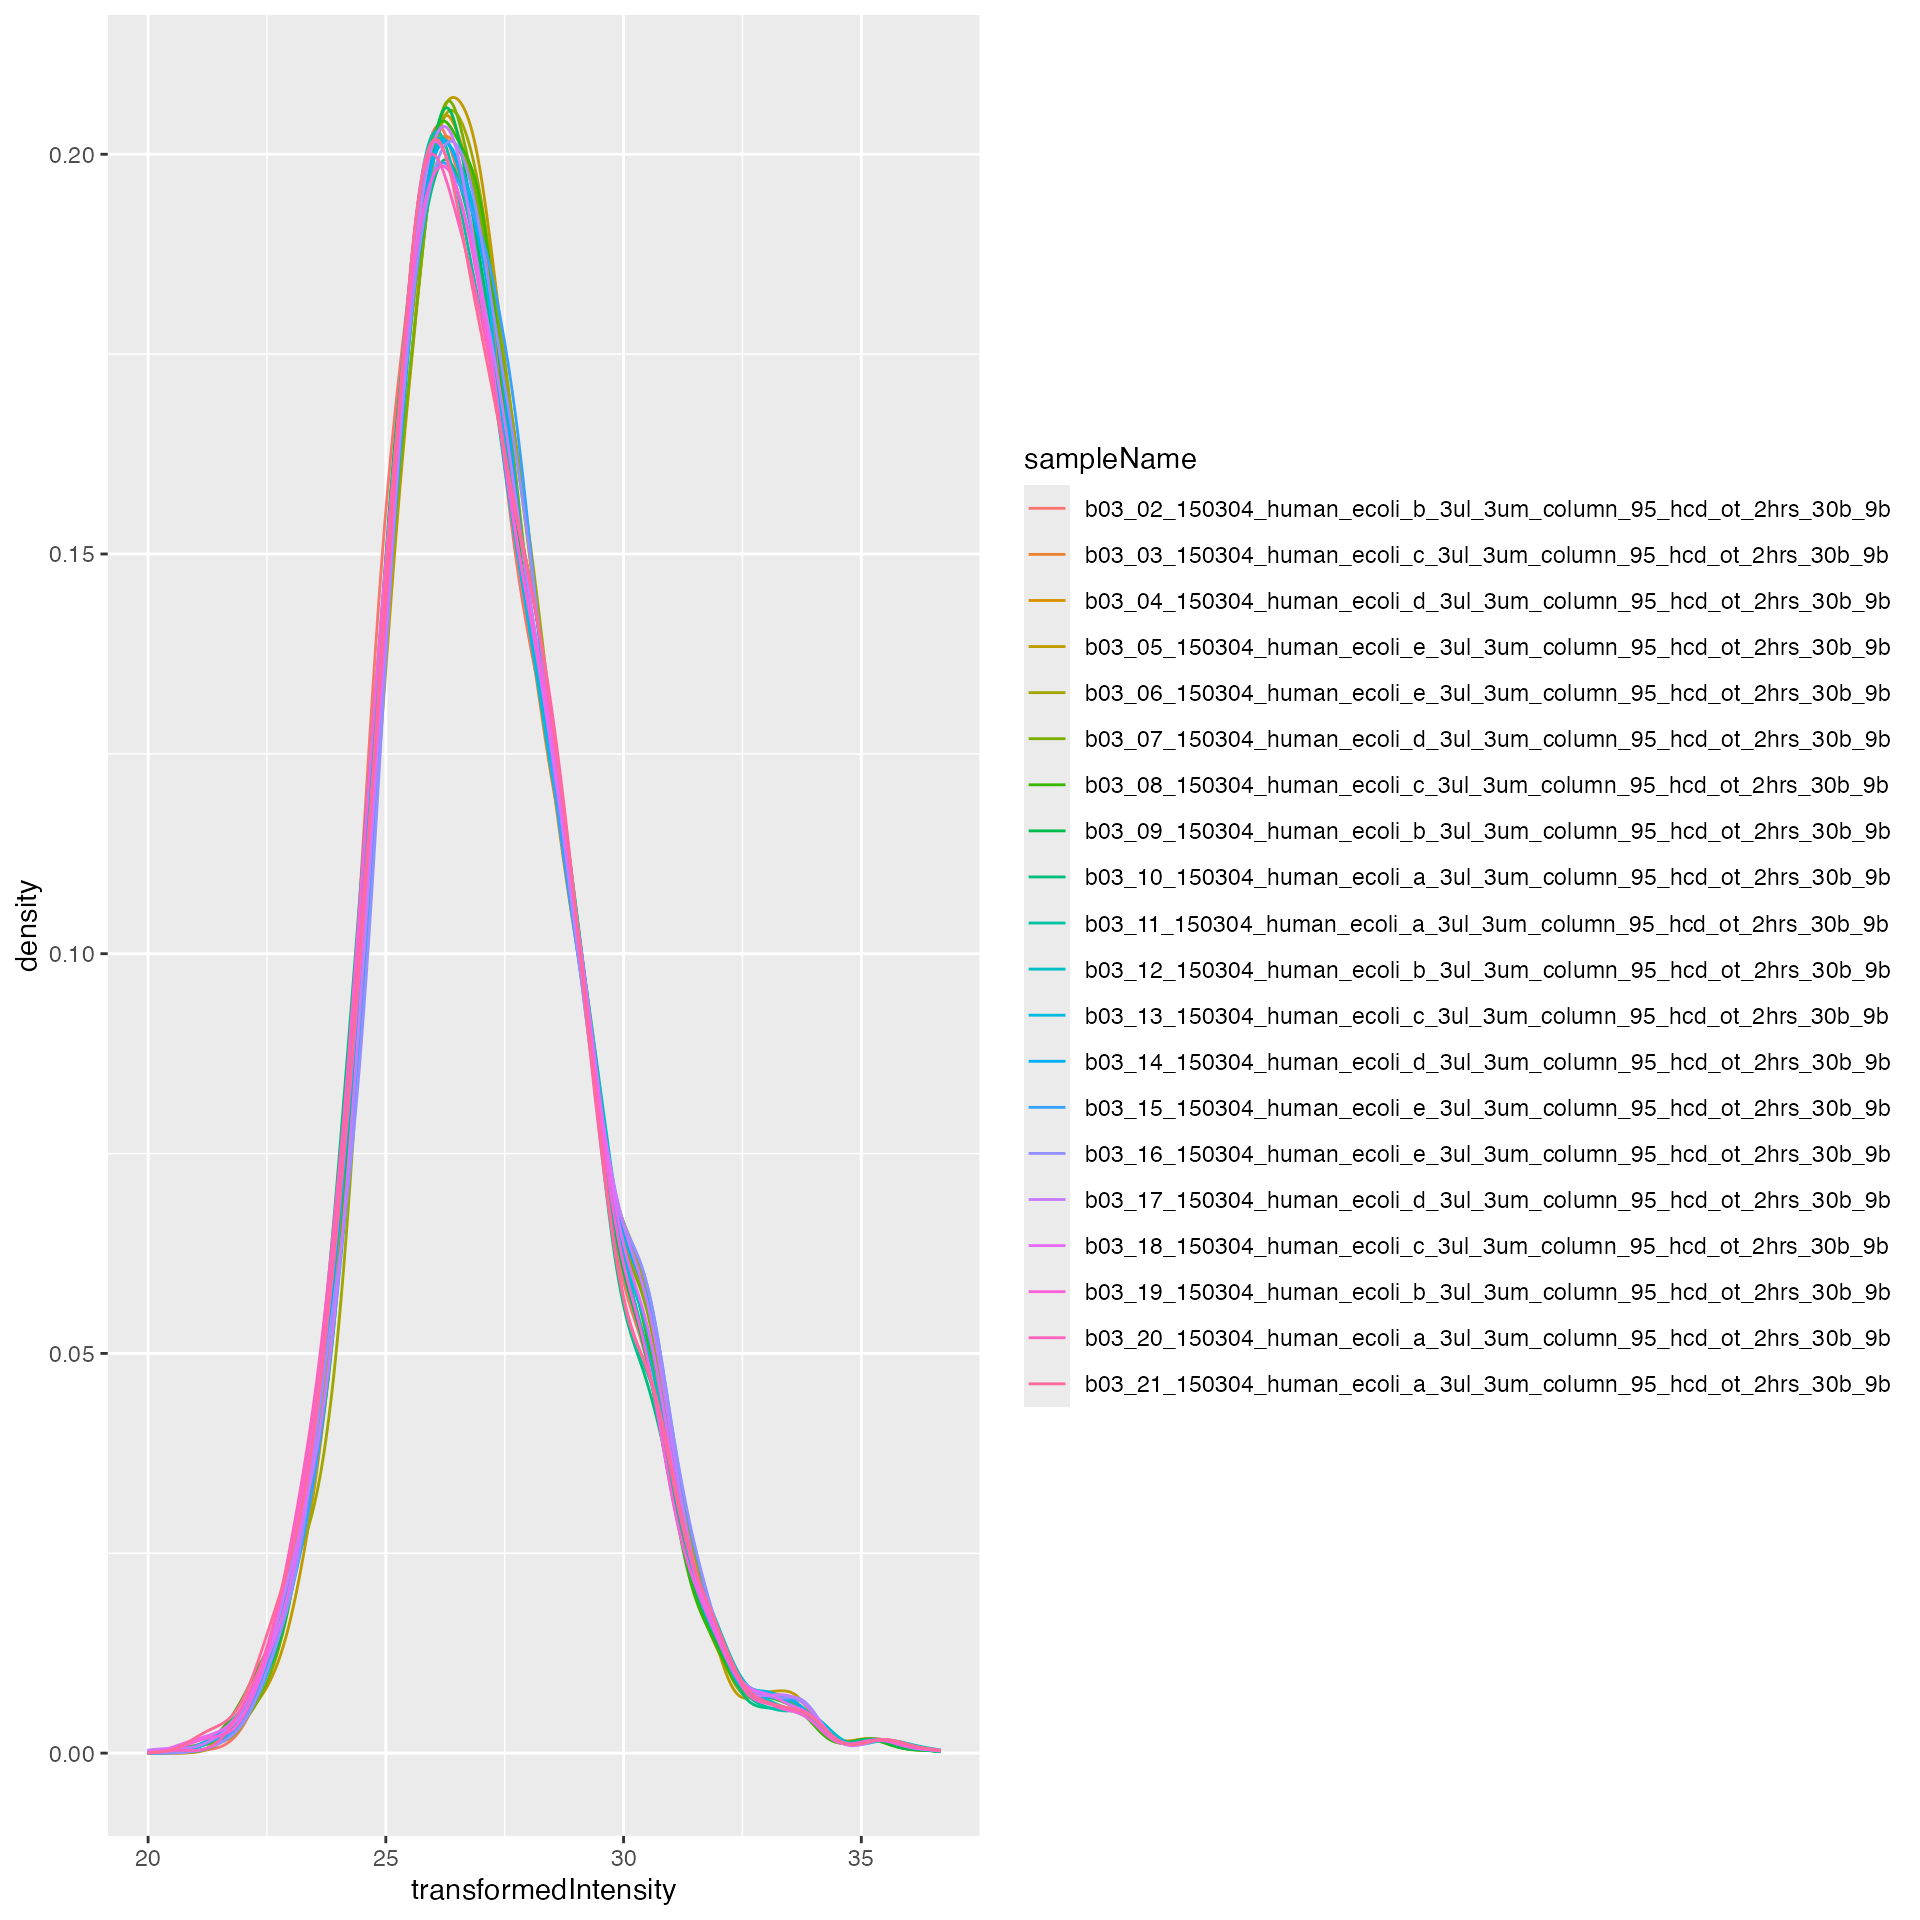
hm <- pl$NA_heatmap()
hm
Model data using prolfqua and specify contrasts
Contrasts <- c(
  "dilution_(9/7.5)_1.2" =   "dilution.e - dilution.d",
  "dilution_(7.5/6)_1.25" =   "dilution.d - dilution.c",
  "dilution_(6/4.5)_1.3(3)" =   "dilution.c - dilution.b",
  "dilution_(4.5/3)_1.5" =   "dilution.b - dilution.a"
)


lmmodel <- "~ dilution."
lmmodel <- paste0(lfqdataNormalized$config$table$get_response() , lmmodel)

modelFunction <- prolfqua::strategy_lm( lmmodel, model_name = "Model")

mod <- prolfqua::build_model(lfqdataNormalized$data, modelFunction)
contr <- prolfqua::Contrasts$new(mod, Contrasts)
contrimp <- prolfqua::ContrastsMissing$new(lfqdataNormalized, Contrasts)

merged <- prolfqua::merge_contrasts_results(contr, contrimp)
mergedmod <- prolfqua::ContrastsModerated$new(merged$merged)

cp <- mergedmod$get_Plotter()
cp$volcano()
## $FDR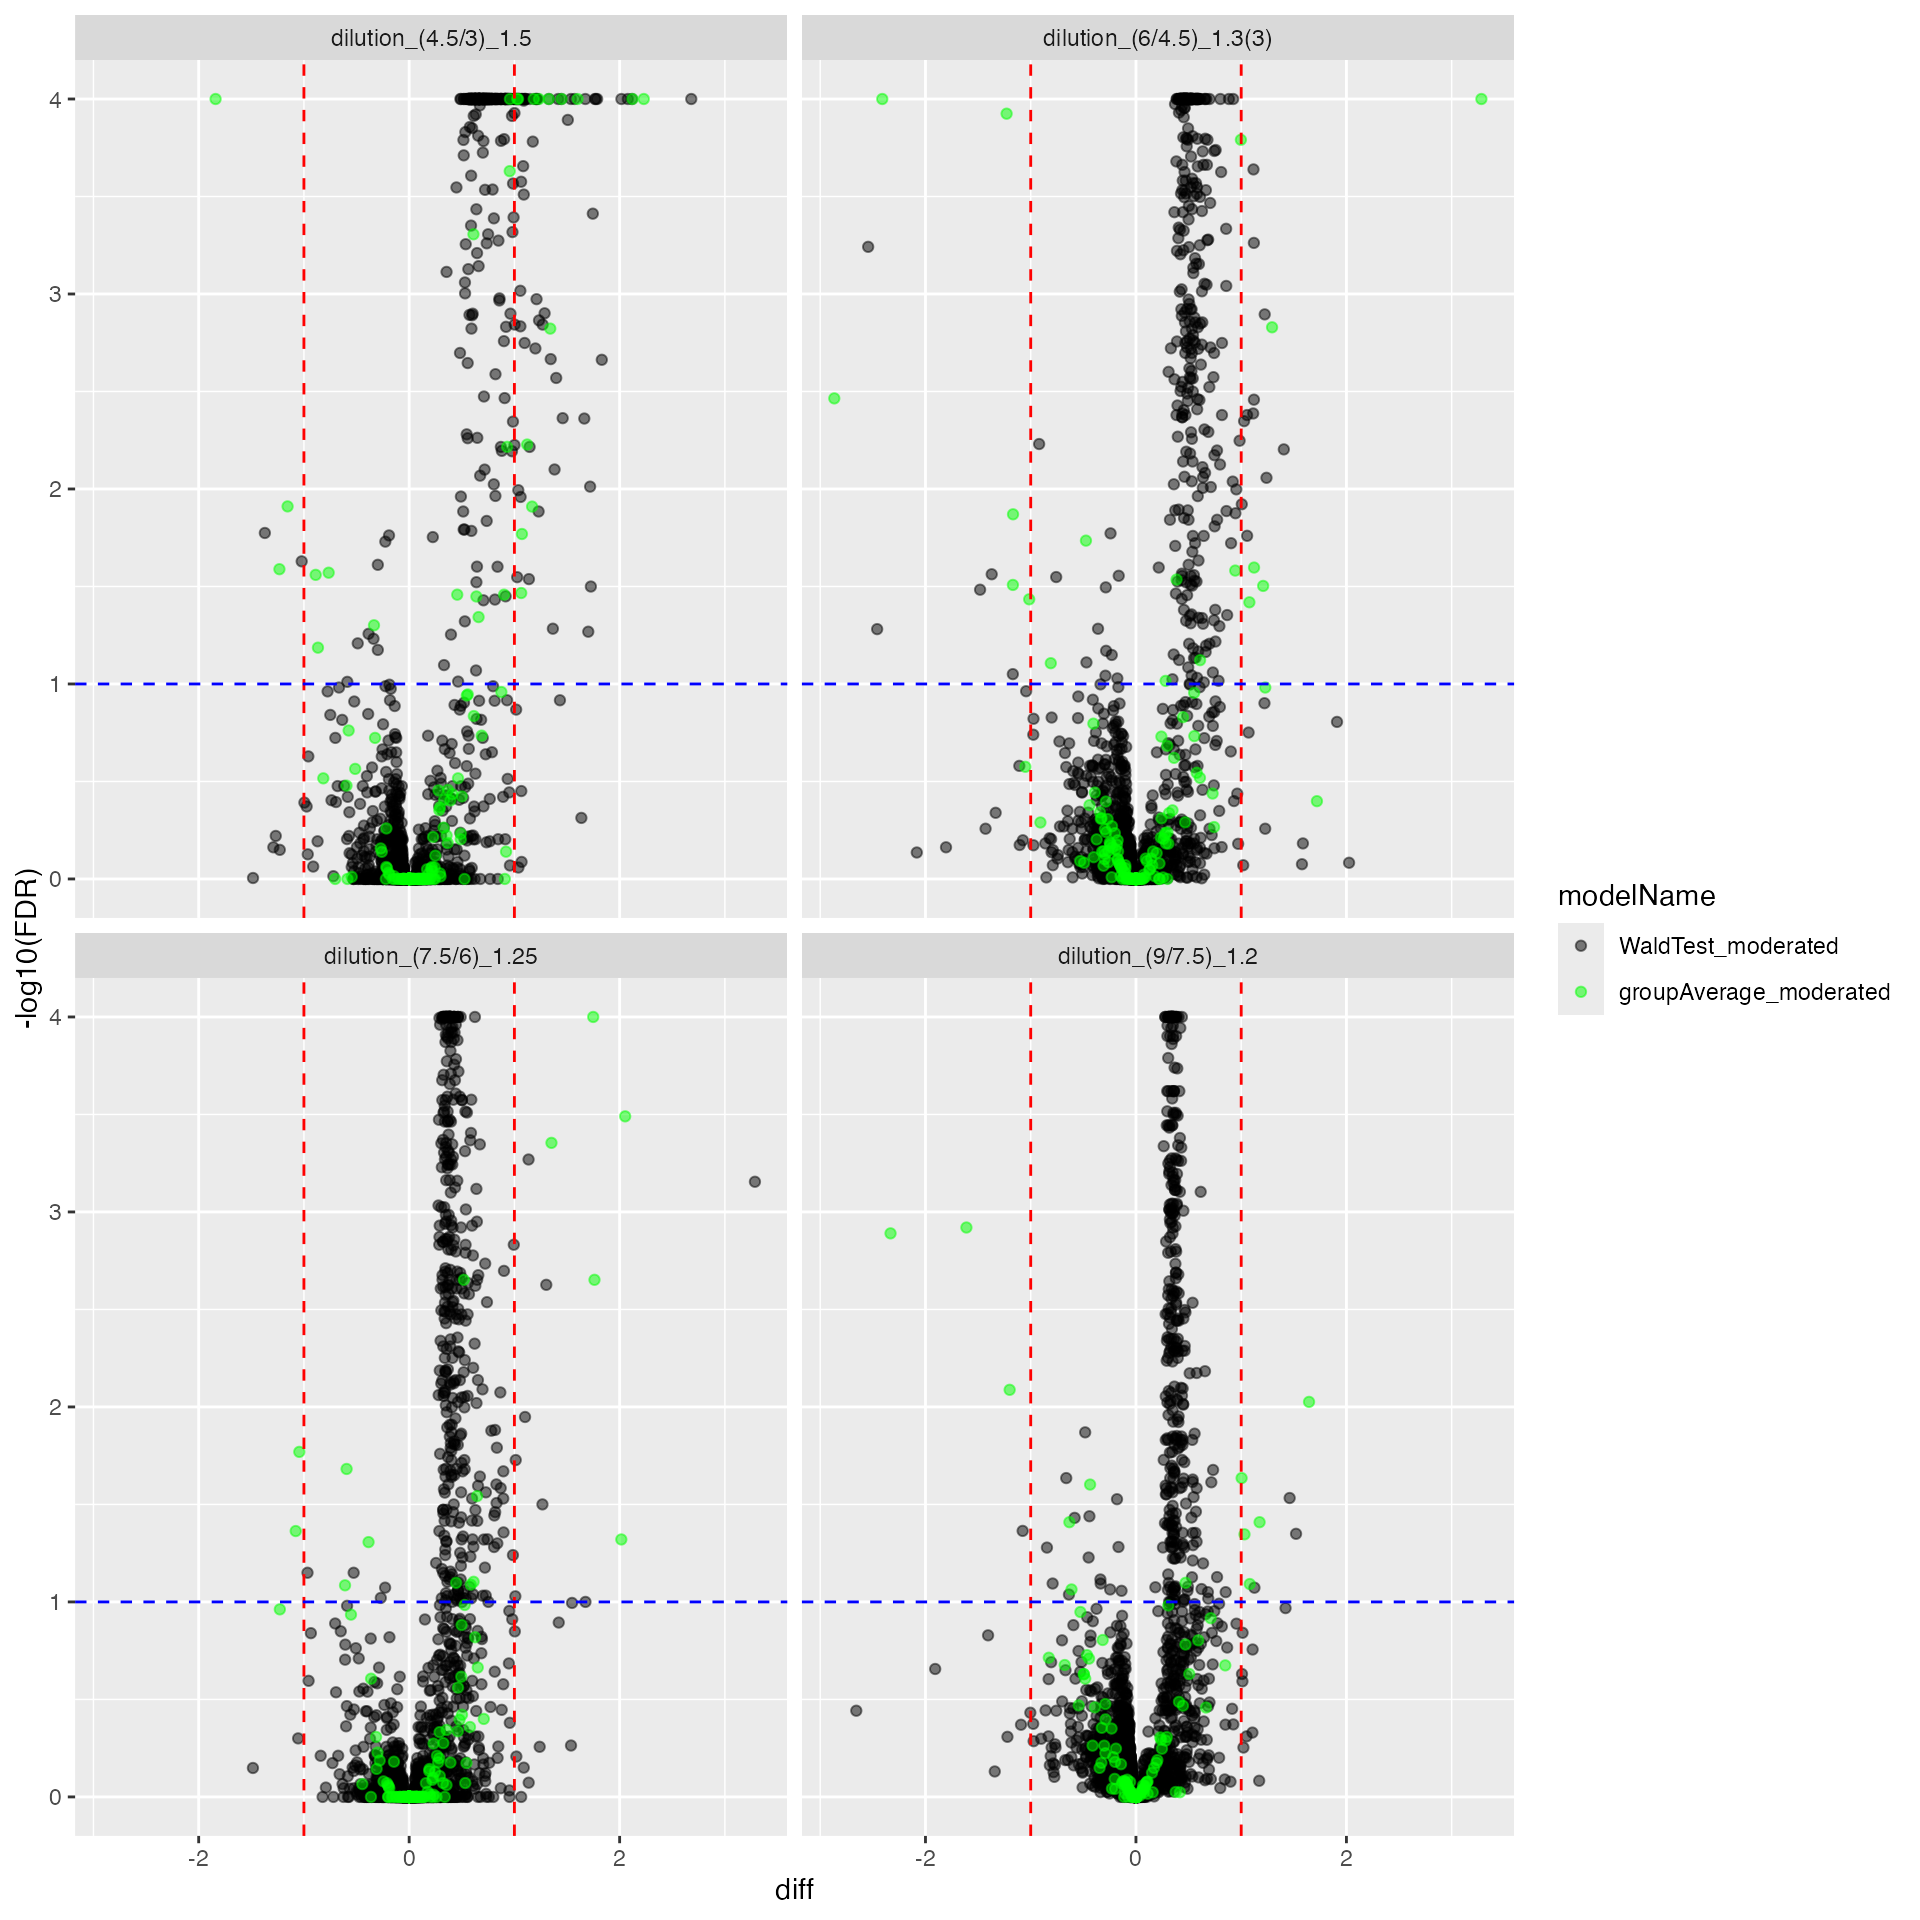
Benchmark data
ttd <- prolfqua::ionstar_bench_preprocess(mergedmod$get_contrasts())
benchmark_prolfqua <- prolfqua::make_benchmark(ttd$data,
                                             model_description = "MSFragger med. polish and lm. density",
                                             model_name = "MSFragger_prot_med_lm",
                                             FDRvsFDP = list(list(score = "FDR", desc = FALSE))
)


knitr::kable(benchmark_prolfqua$pAUC_summaries()$ftable$content)| contrast | what | AUC | pAUC_10 | pAUC_20 |
|---|---|---|---|---|
| all | diff | 94.03414 | 72.03297 | 80.81840 |
| all | scaled.p.value | 95.12016 | 81.86899 | 85.01266 |
| all | statistic | 95.01501 | 80.86869 | 84.54175 |
| dilution_(4.5/3)_1.5 | diff | 91.74353 | 71.35642 | 74.94692 |
| dilution_(4.5/3)_1.5 | scaled.p.value | 91.97449 | 74.07253 | 75.69785 |
| dilution_(4.5/3)_1.5 | statistic | 91.88659 | 73.16519 | 75.26106 |
| dilution_(6/4.5)_1.3(3) | diff | 94.51047 | 77.29426 | 83.11132 |
| dilution_(6/4.5)_1.3(3) | scaled.p.value | 95.25739 | 82.86520 | 85.39251 |
| dilution_(6/4.5)_1.3(3) | statistic | 95.15824 | 82.03018 | 84.98705 |
| dilution_(7.5/6)_1.25 | diff | 93.58321 | 64.35484 | 79.10116 |
| dilution_(7.5/6)_1.25 | scaled.p.value | 95.02455 | 82.23264 | 86.55908 |
| dilution_(7.5/6)_1.25 | statistic | 94.93966 | 81.16409 | 86.10408 |
| dilution_(9/7.5)_1.2 | diff | 95.95465 | 74.05003 | 85.26557 |
| dilution_(9/7.5)_1.2 | scaled.p.value | 97.96069 | 89.12013 | 92.60967 |
| dilution_(9/7.5)_1.2 | statistic | 97.80569 | 87.74253 | 91.93801 |
prolfqua::table_facade(benchmark_prolfqua$smc$summary, "Nr of estimated contrasts")| nr_missing | protein_Id |
|---|---|
| 0 | 3836 |
benchmark_prolfqua$plot_score_distribution()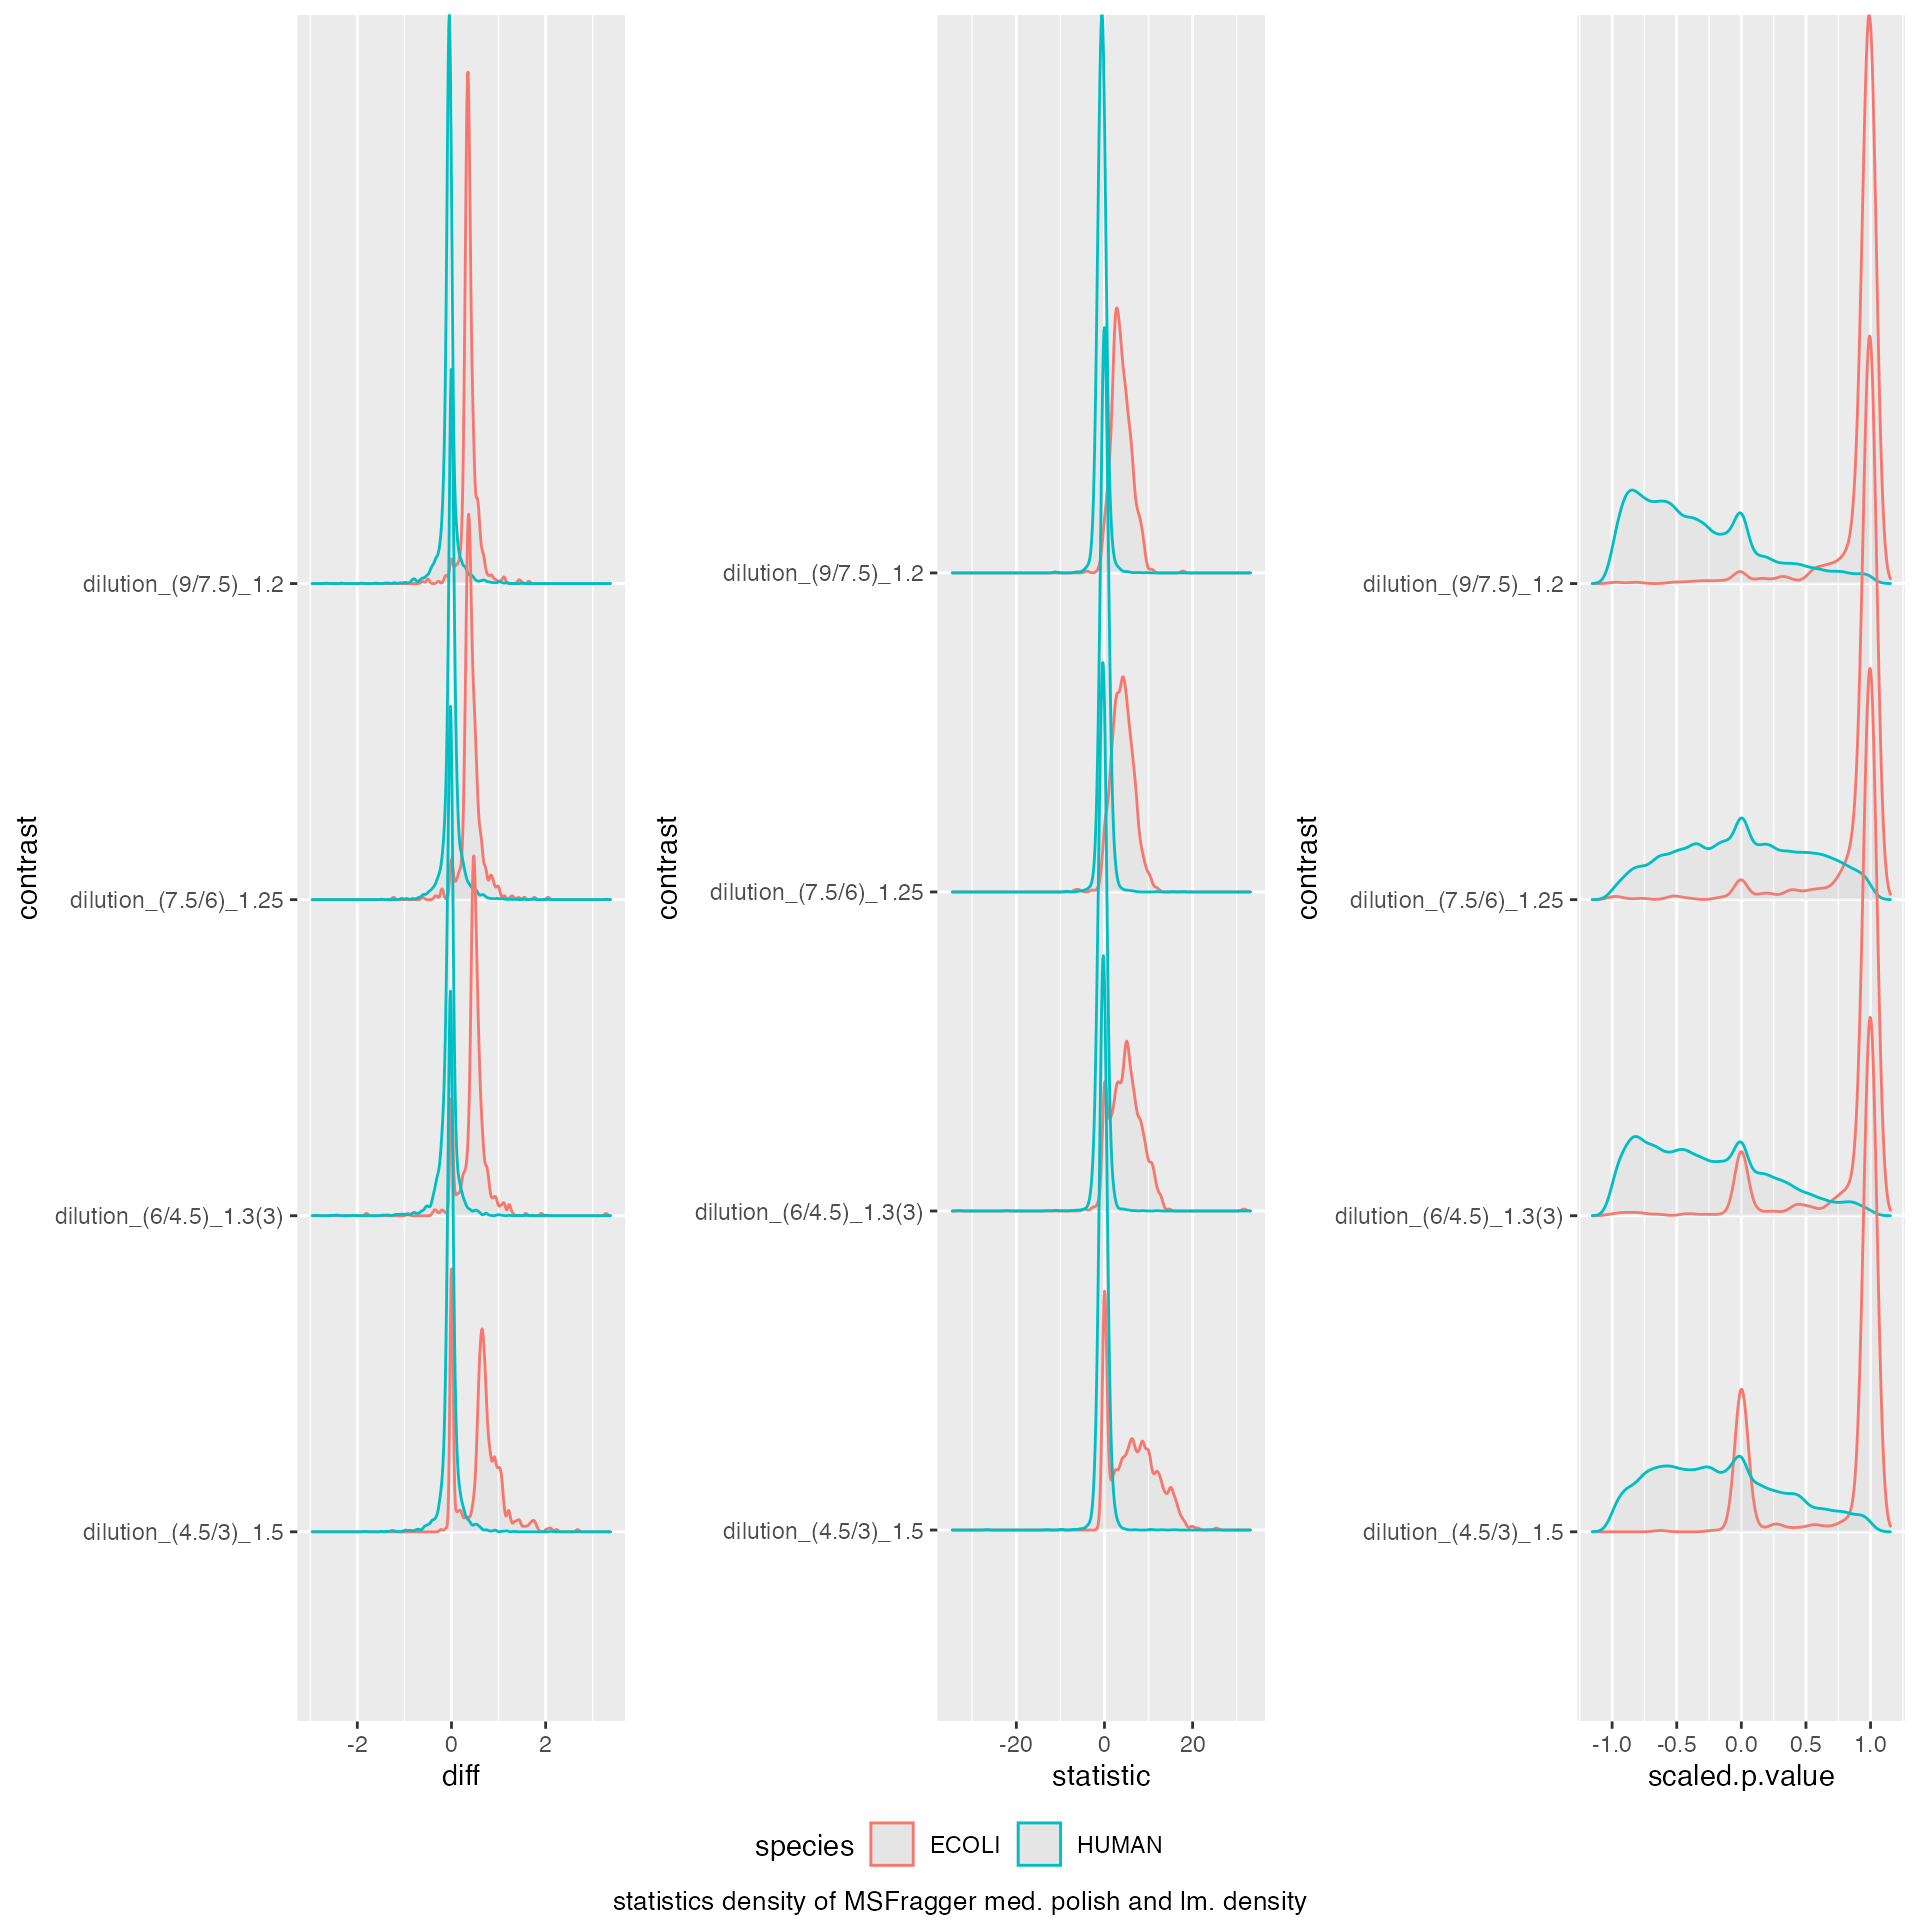
benchmark_prolfqua$plot_ROC(0.05)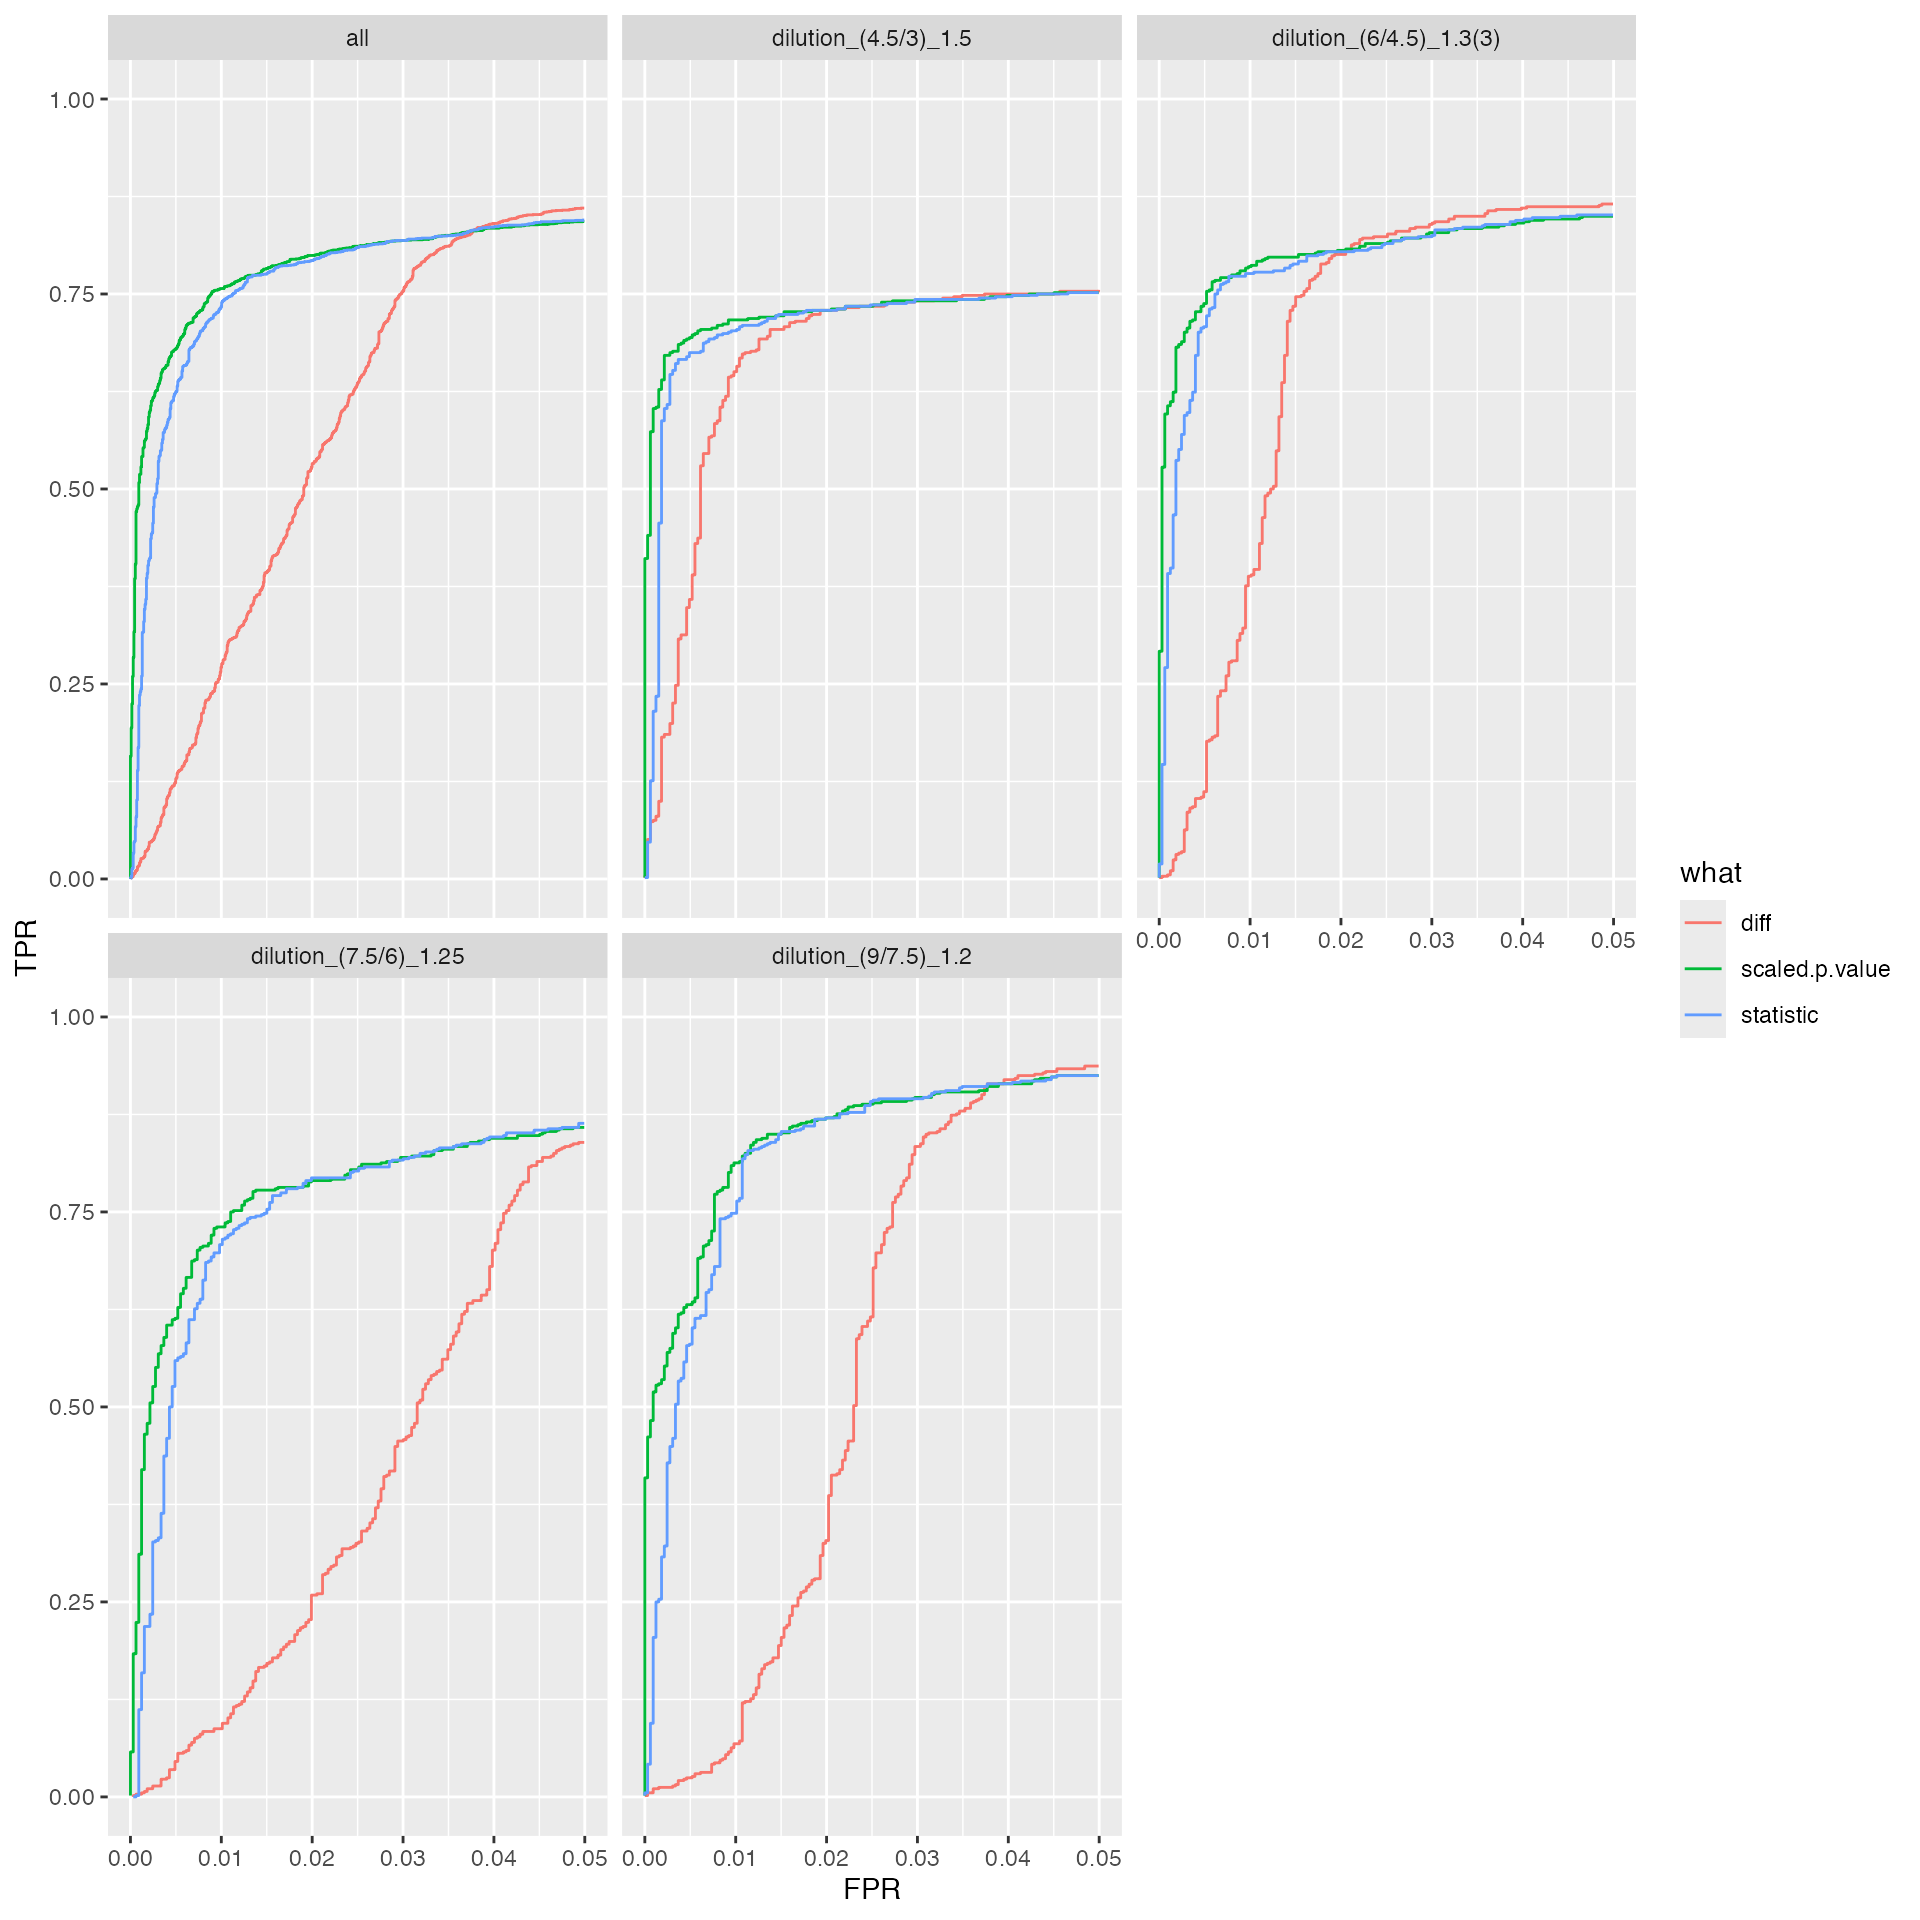
benchmark_prolfqua$plot_FDRvsFDP()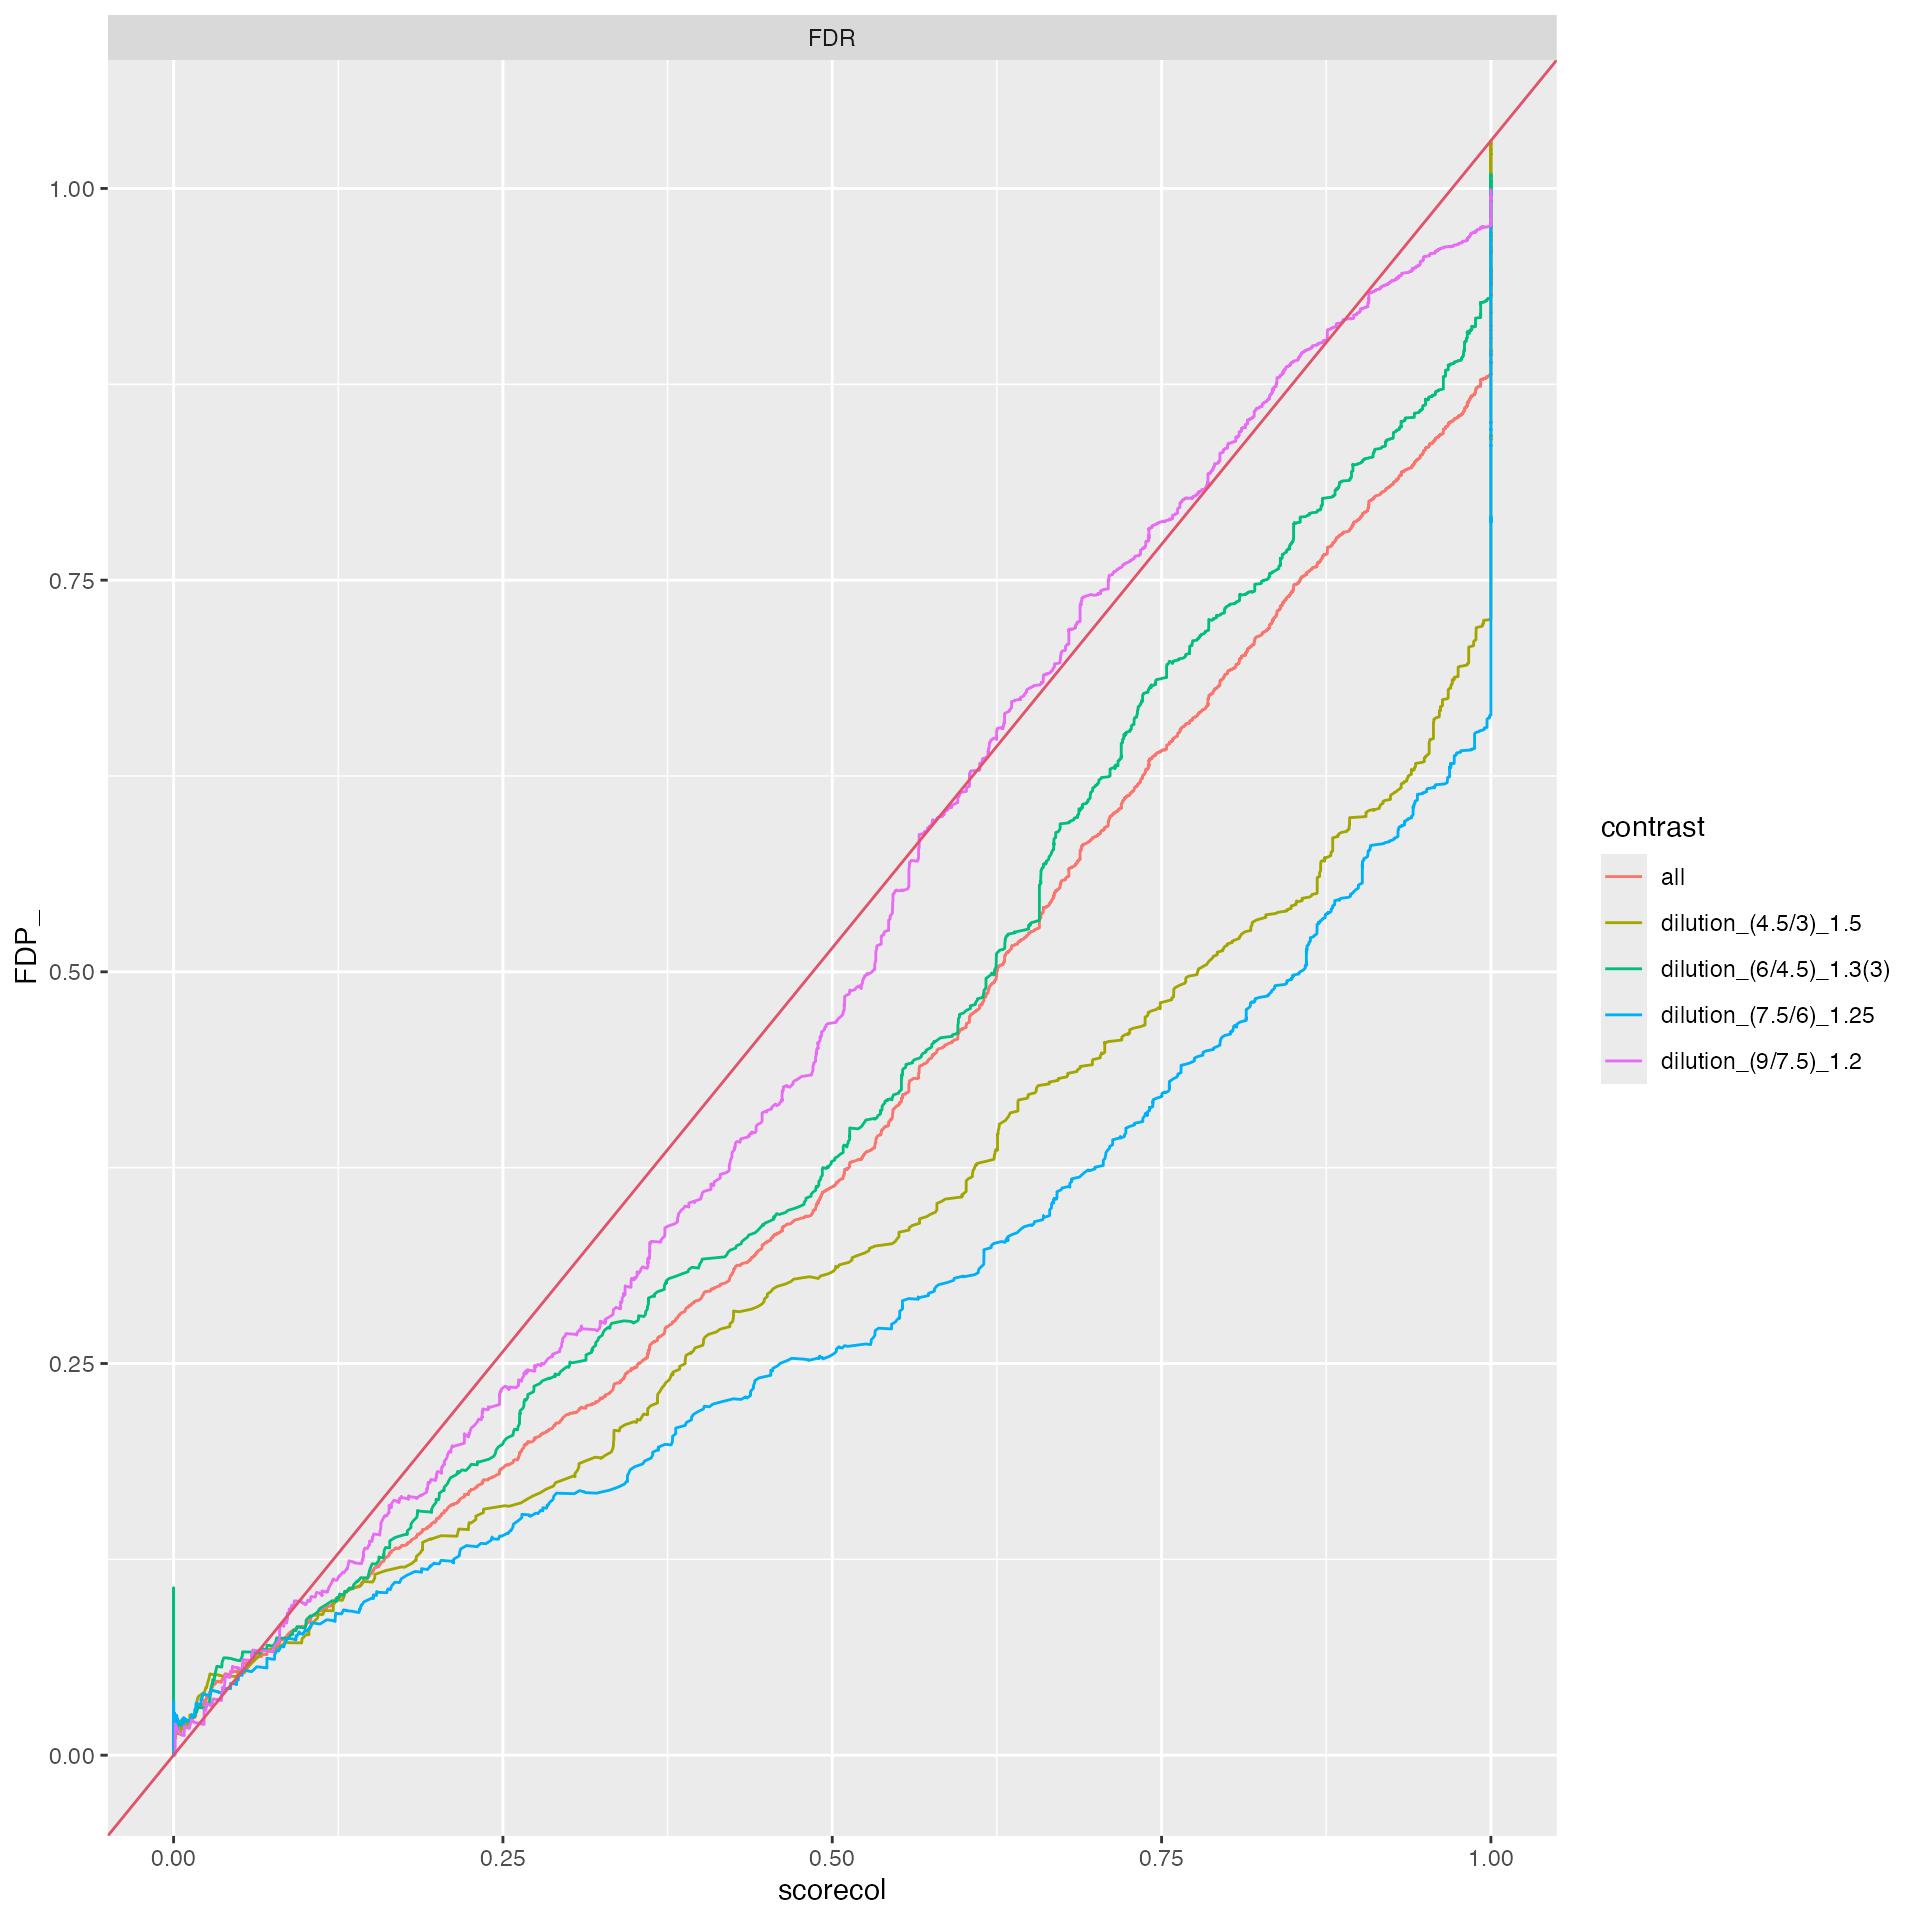
Model data using proDA and specify contrasts
se <- prolfqua::LFQDataToSummarizedExperiment(lfqdataNormalized)
fit <- proDA::proDA(se, design = ~ dilution. - 1, data_is_log_transformed = TRUE)

contr <- list()
contr[["dilution_(9/7.5)_1.2"]] <- data.frame(
  contrast = "dilution_(9/7.5)_1.2",
  proDA::test_diff(fit, contrast = "dilution.e - dilution.d"))
contr[["dilution_(7.5/6)_1.25"]] <- data.frame(
  contrast = "dilution_(7.5/6)_1.25",
  proDA::test_diff(fit, contrast = "dilution.d - dilution.c"))
contr[["dilution_(6/4.5)_1.3(3)"]] <- data.frame(
  contrast = "dilution_(6/4.5)_1.3(3)",
  proDA::test_diff(fit, contrast = "dilution.c - dilution.b"))
contr[["dilution_(4.5/3)_1.5"]] <- data.frame(
  contrast = "dilution_(4.5/3)_1.5",
  proDA::test_diff(fit, contrast = "dilution.b - dilution.a" ))

bb <- dplyr::bind_rows(contr)
Benchmark data
ttd <- prolfqua::ionstar_bench_preprocess( bb , idcol = "name" )

benchmark_proDA <- prolfqua::make_benchmark(ttd$data,
                                            contrast = "contrast",
                                            toscale = c("pval"),
                                            fcestimate = "diff",
                                            benchmark = list(
                                              list(score = "diff", desc = TRUE),
                                              list(score = "t_statistic", desc = TRUE),
                                              list(score = "scaled.pval", desc = TRUE)
                                            ),
                                            model_description = "proDA_medpolishInt",
                                            model_name = "proDA_medpolishInt",
                                            FDRvsFDP = list(list(score = "adj_pval", desc = FALSE))
                                            , hierarchy = c("name"), summarizeNA = "t_statistic"
)

sumarry <- benchmark_proDA$smc$summary
prolfqua::table_facade(sumarry, caption = "nr of proteins with 0, 1, 2, 3 missing contrasts.")| nr_missing | name |
|---|---|
| 0 | 3836 |
knitr::kable(benchmark_proDA$pAUC_summaries()$ftable$content)| contrast | what | AUC | pAUC_10 | pAUC_20 |
|---|---|---|---|---|
| all | diff | 92.00232 | 61.85940 | 76.45388 |
| all | scaled.pval | 94.25312 | 80.02306 | 83.62545 |
| all | t_statistic | 94.25312 | 80.02306 | 83.62545 |
| dilution_(4.5/3)_1.5 | diff | 89.80219 | 69.12236 | 76.47396 |
| dilution_(4.5/3)_1.5 | scaled.pval | 91.78140 | 74.78115 | 77.29105 |
| dilution_(4.5/3)_1.5 | t_statistic | 91.78140 | 74.78115 | 77.29105 |
| dilution_(6/4.5)_1.3(3) | diff | 92.38434 | 68.83313 | 79.75488 |
| dilution_(6/4.5)_1.3(3) | scaled.pval | 94.09322 | 81.69435 | 84.46938 |
| dilution_(6/4.5)_1.3(3) | t_statistic | 94.09322 | 81.69435 | 84.46938 |
| dilution_(7.5/6)_1.25 | diff | 91.19993 | 48.03943 | 70.53478 |
| dilution_(7.5/6)_1.25 | scaled.pval | 93.94143 | 79.59741 | 84.24335 |
| dilution_(7.5/6)_1.25 | t_statistic | 93.94143 | 79.59741 | 84.24335 |
| dilution_(9/7.5)_1.2 | diff | 94.43516 | 61.60284 | 79.01894 |
| dilution_(9/7.5)_1.2 | scaled.pval | 97.21415 | 85.21763 | 89.28992 |
| dilution_(9/7.5)_1.2 | t_statistic | 97.21415 | 85.21763 | 89.28992 |
prolfqua::table_facade(benchmark_prolfqua$smc$summary, "Nr of estimated contrasts")| nr_missing | protein_Id |
|---|---|
| 0 | 3836 |
benchmark_proDA$plot_score_distribution()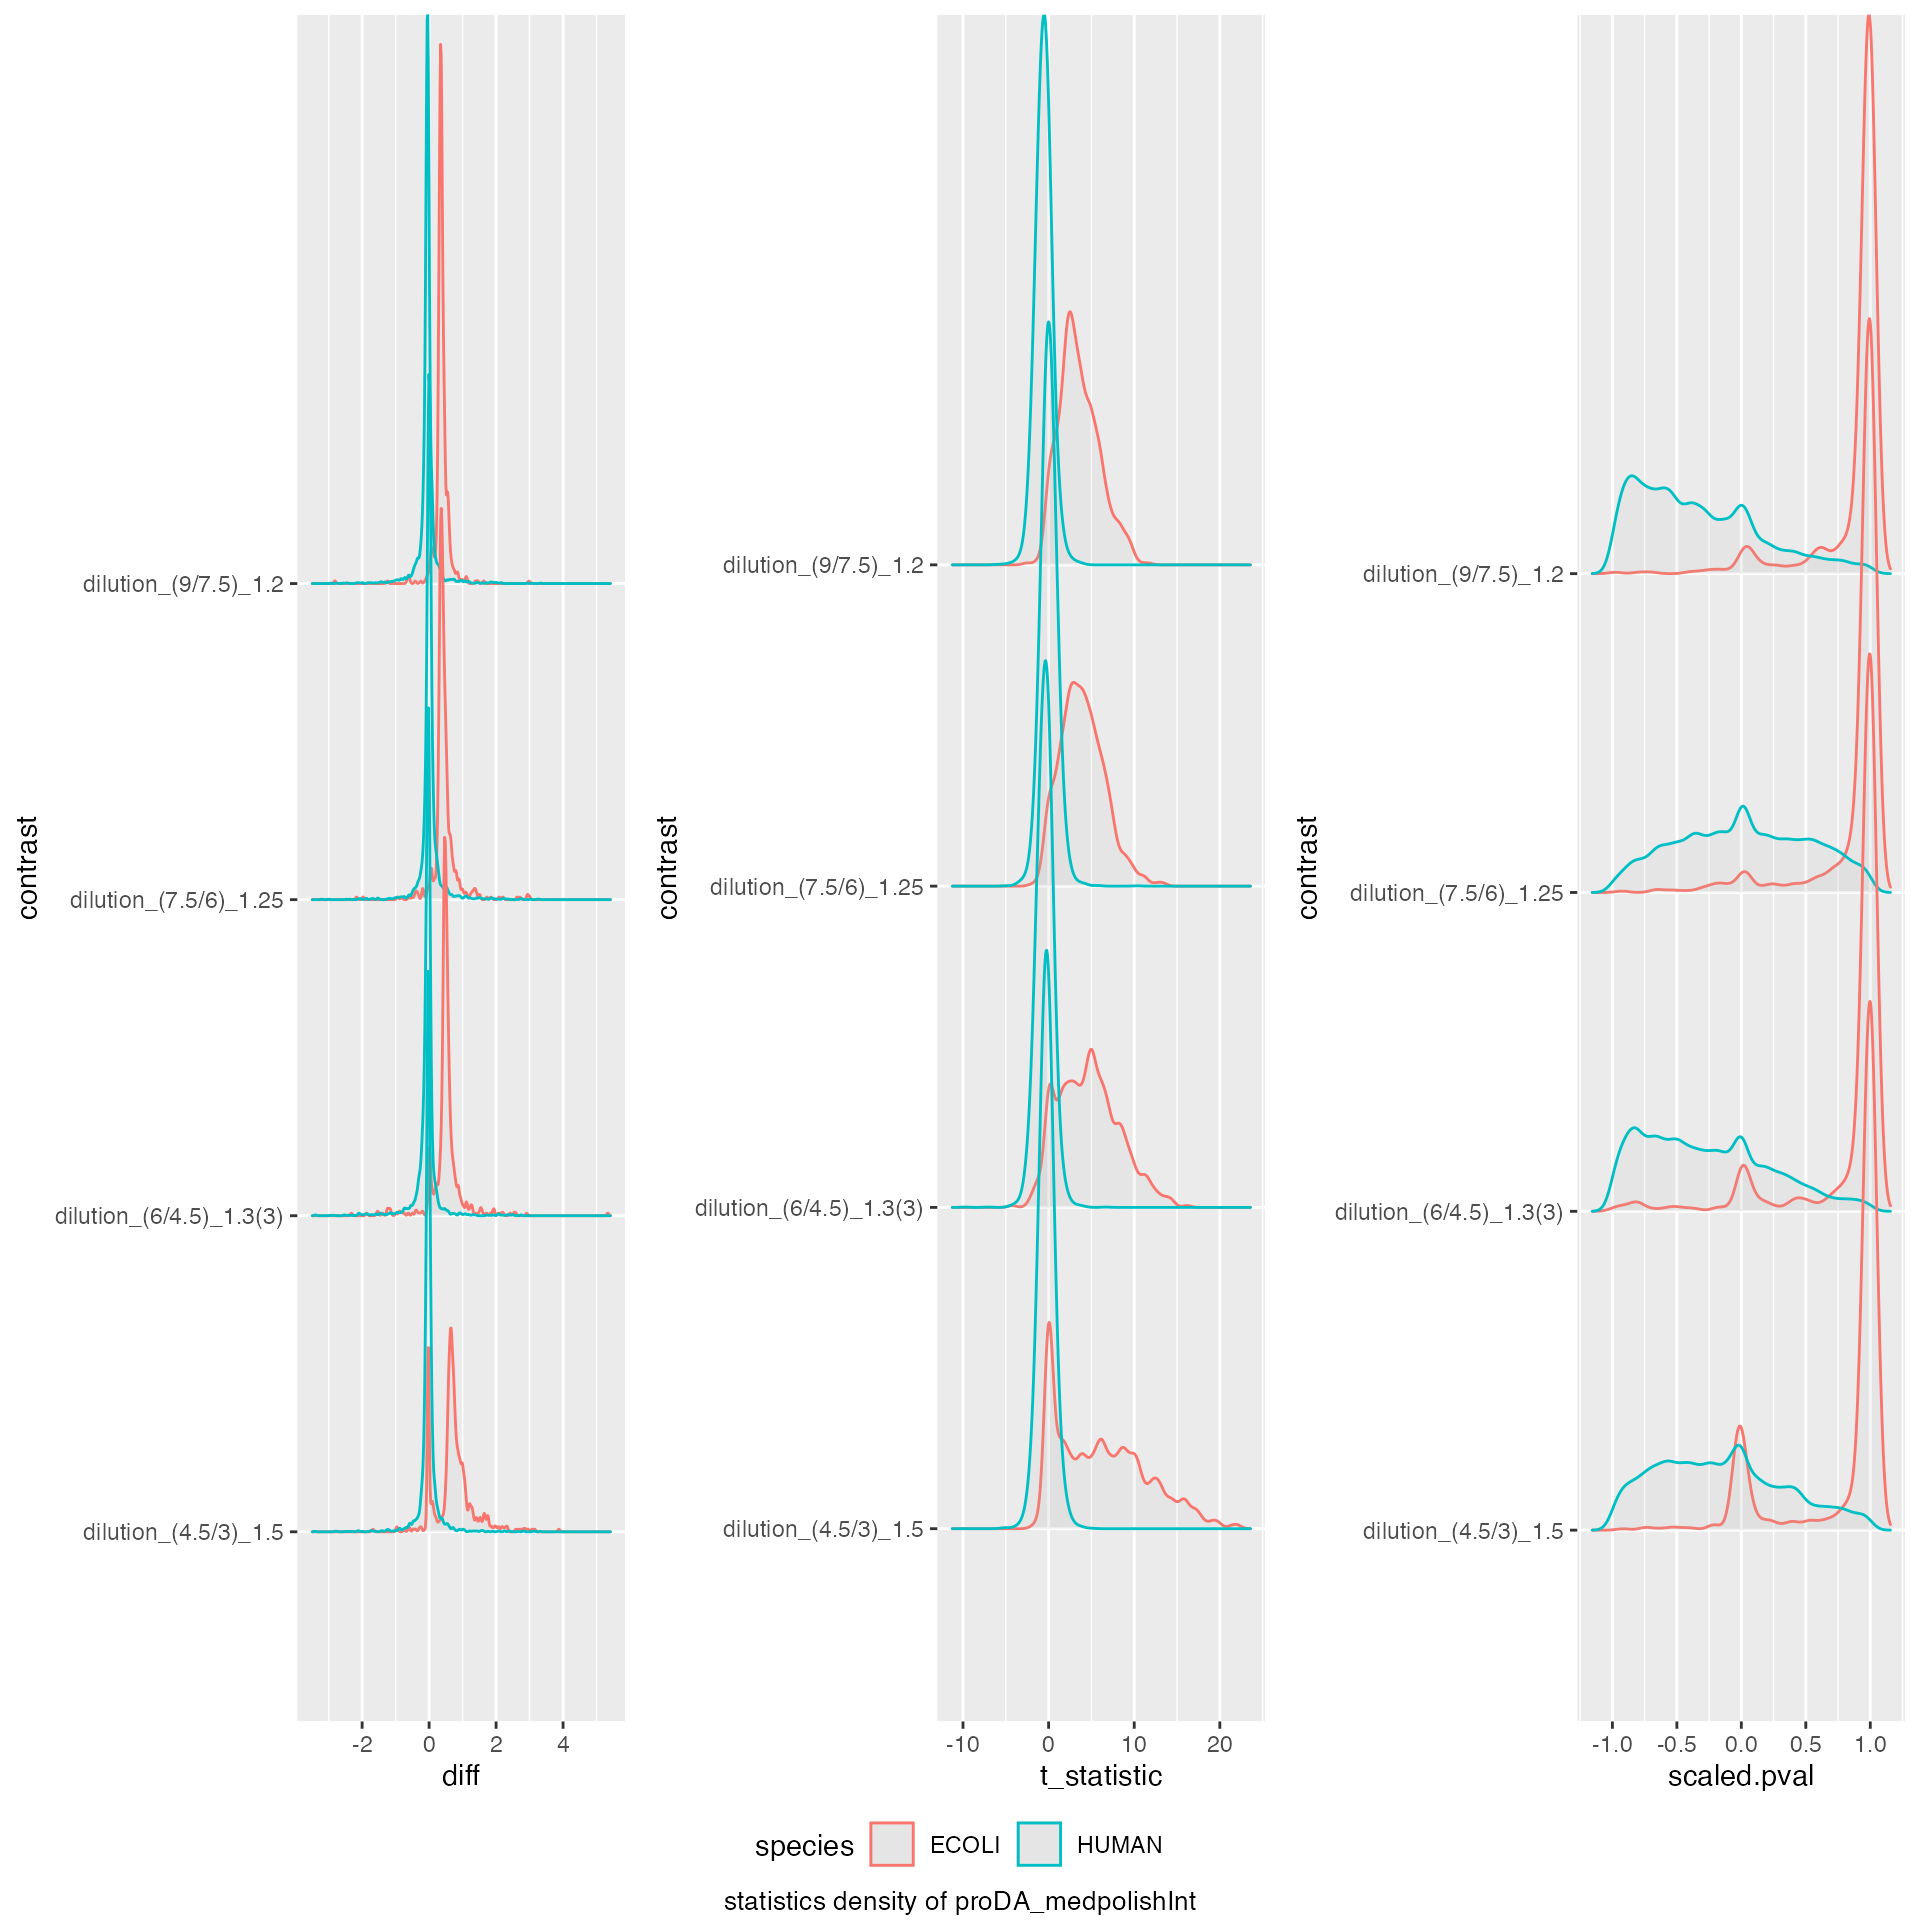
benchmark_proDA$plot_ROC(0.05)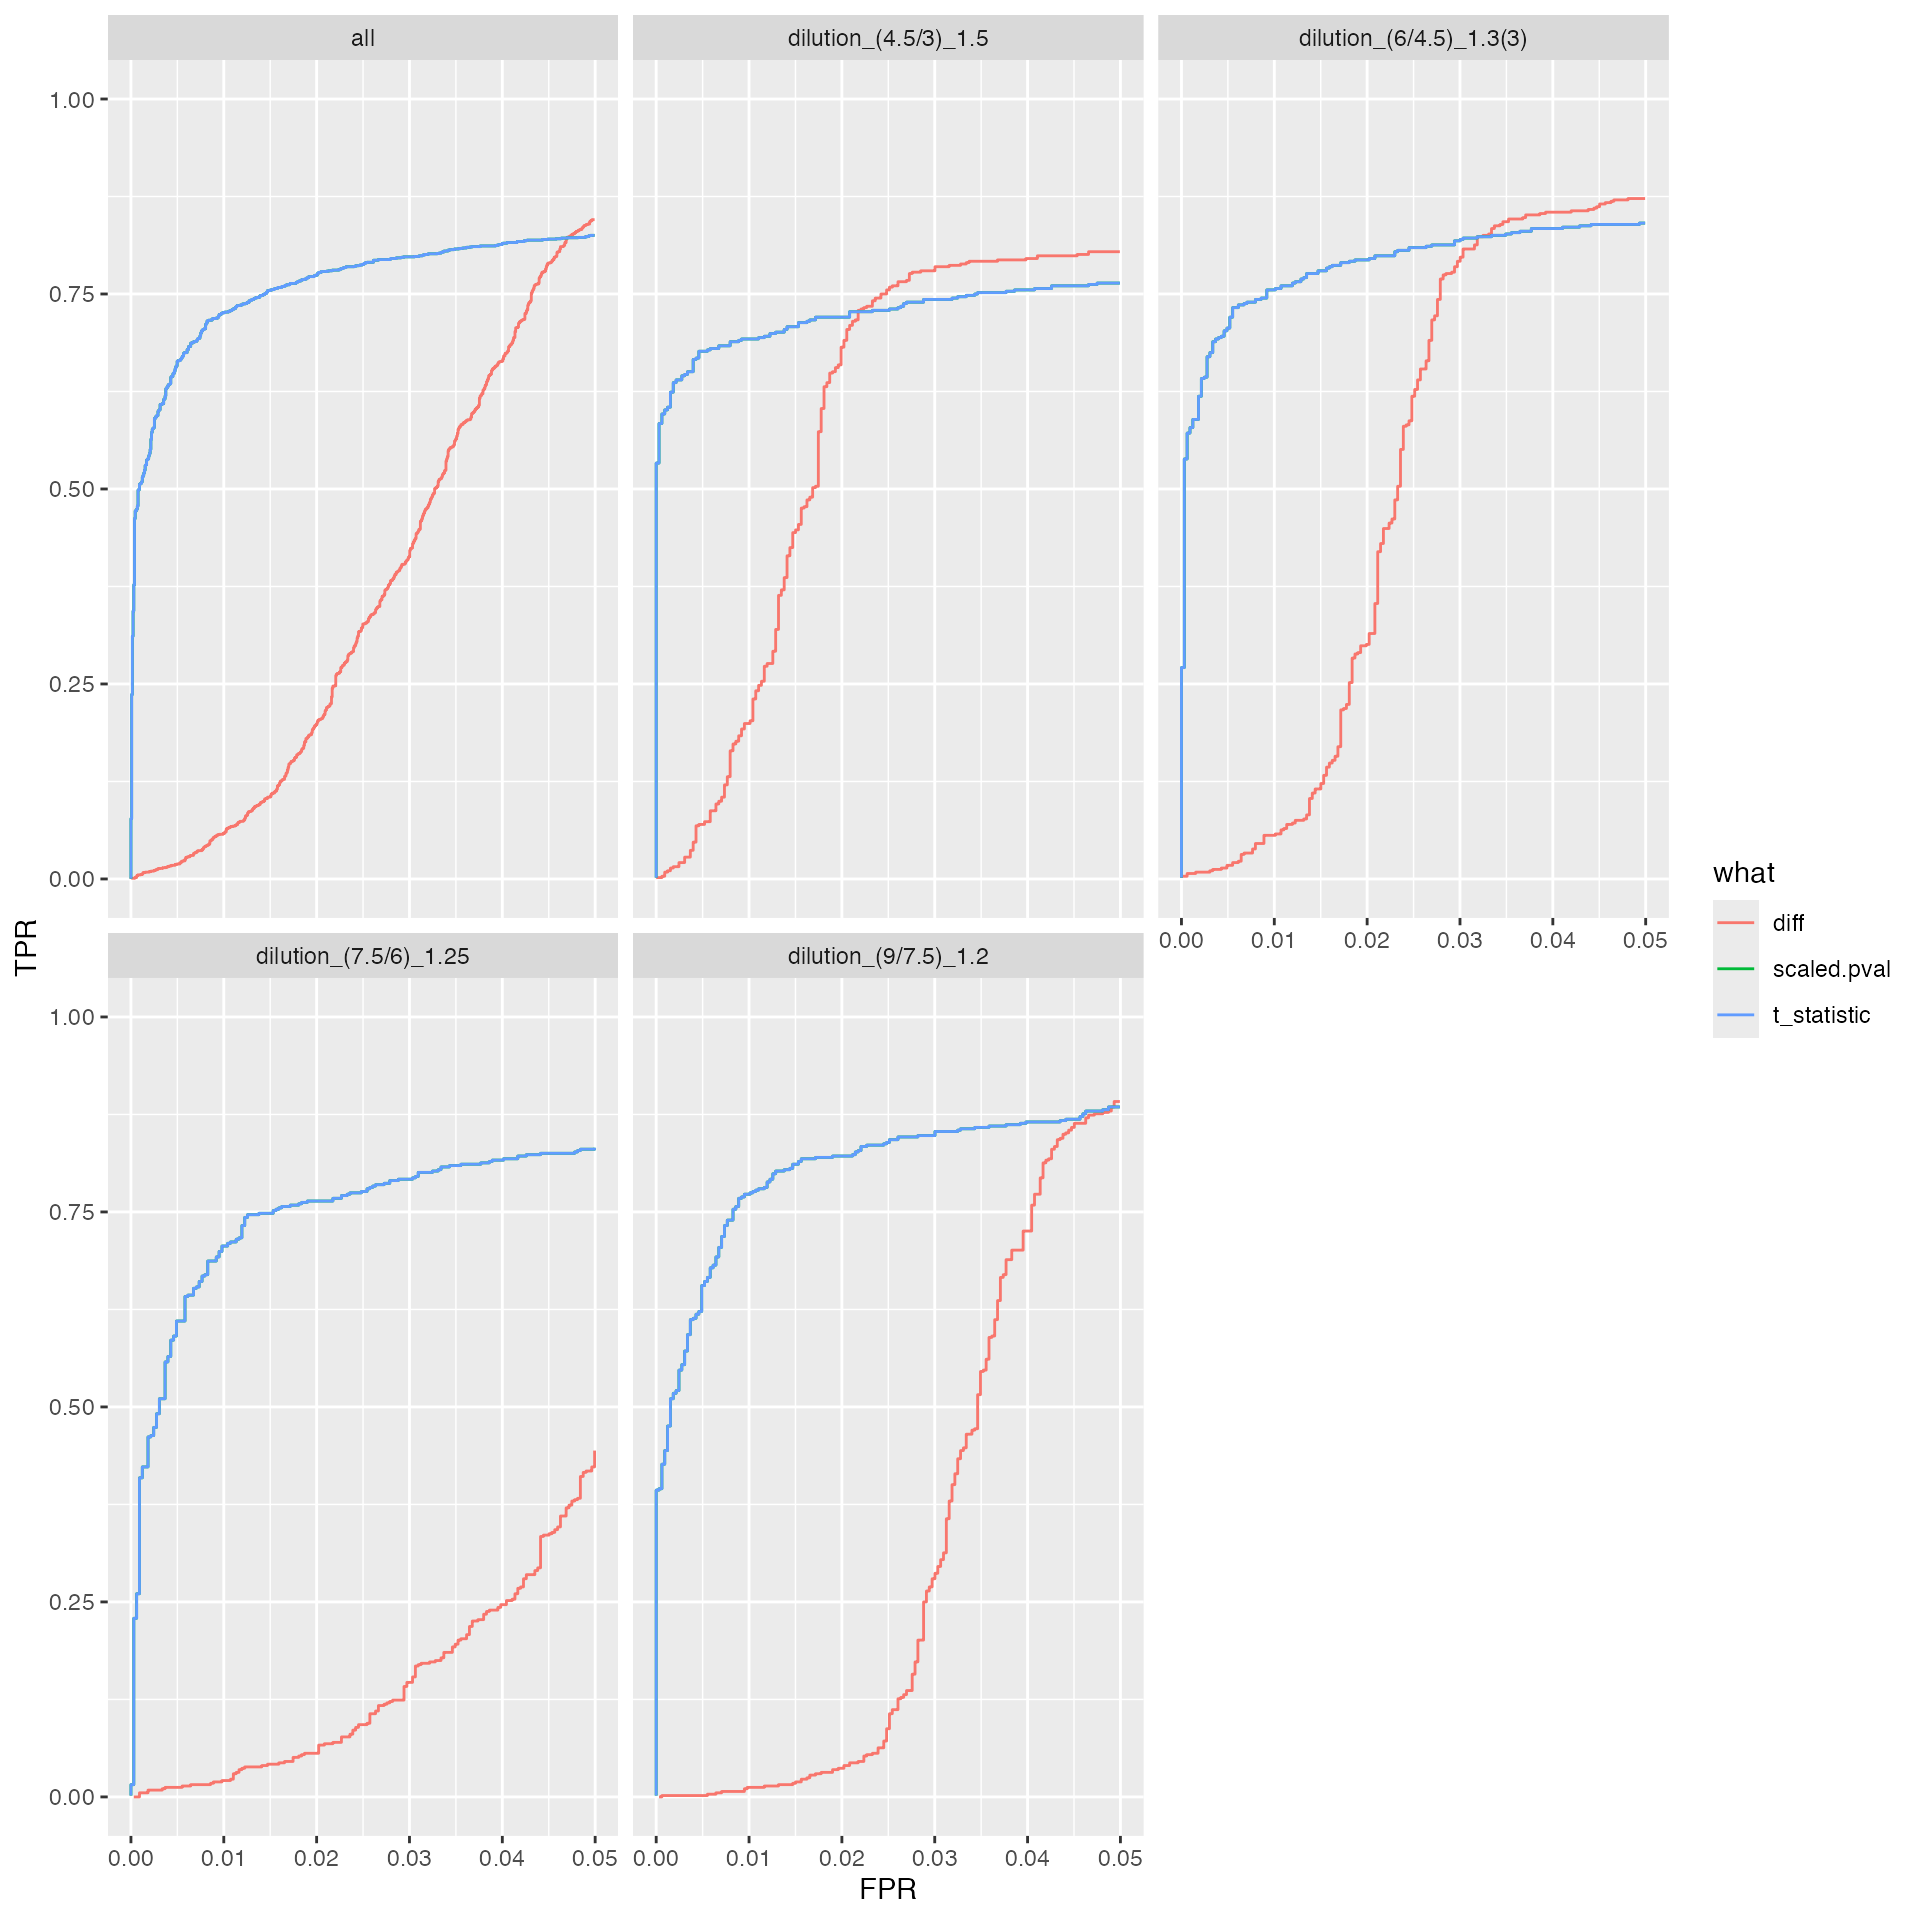
benchmark_proDA$plot_FDRvsFDP()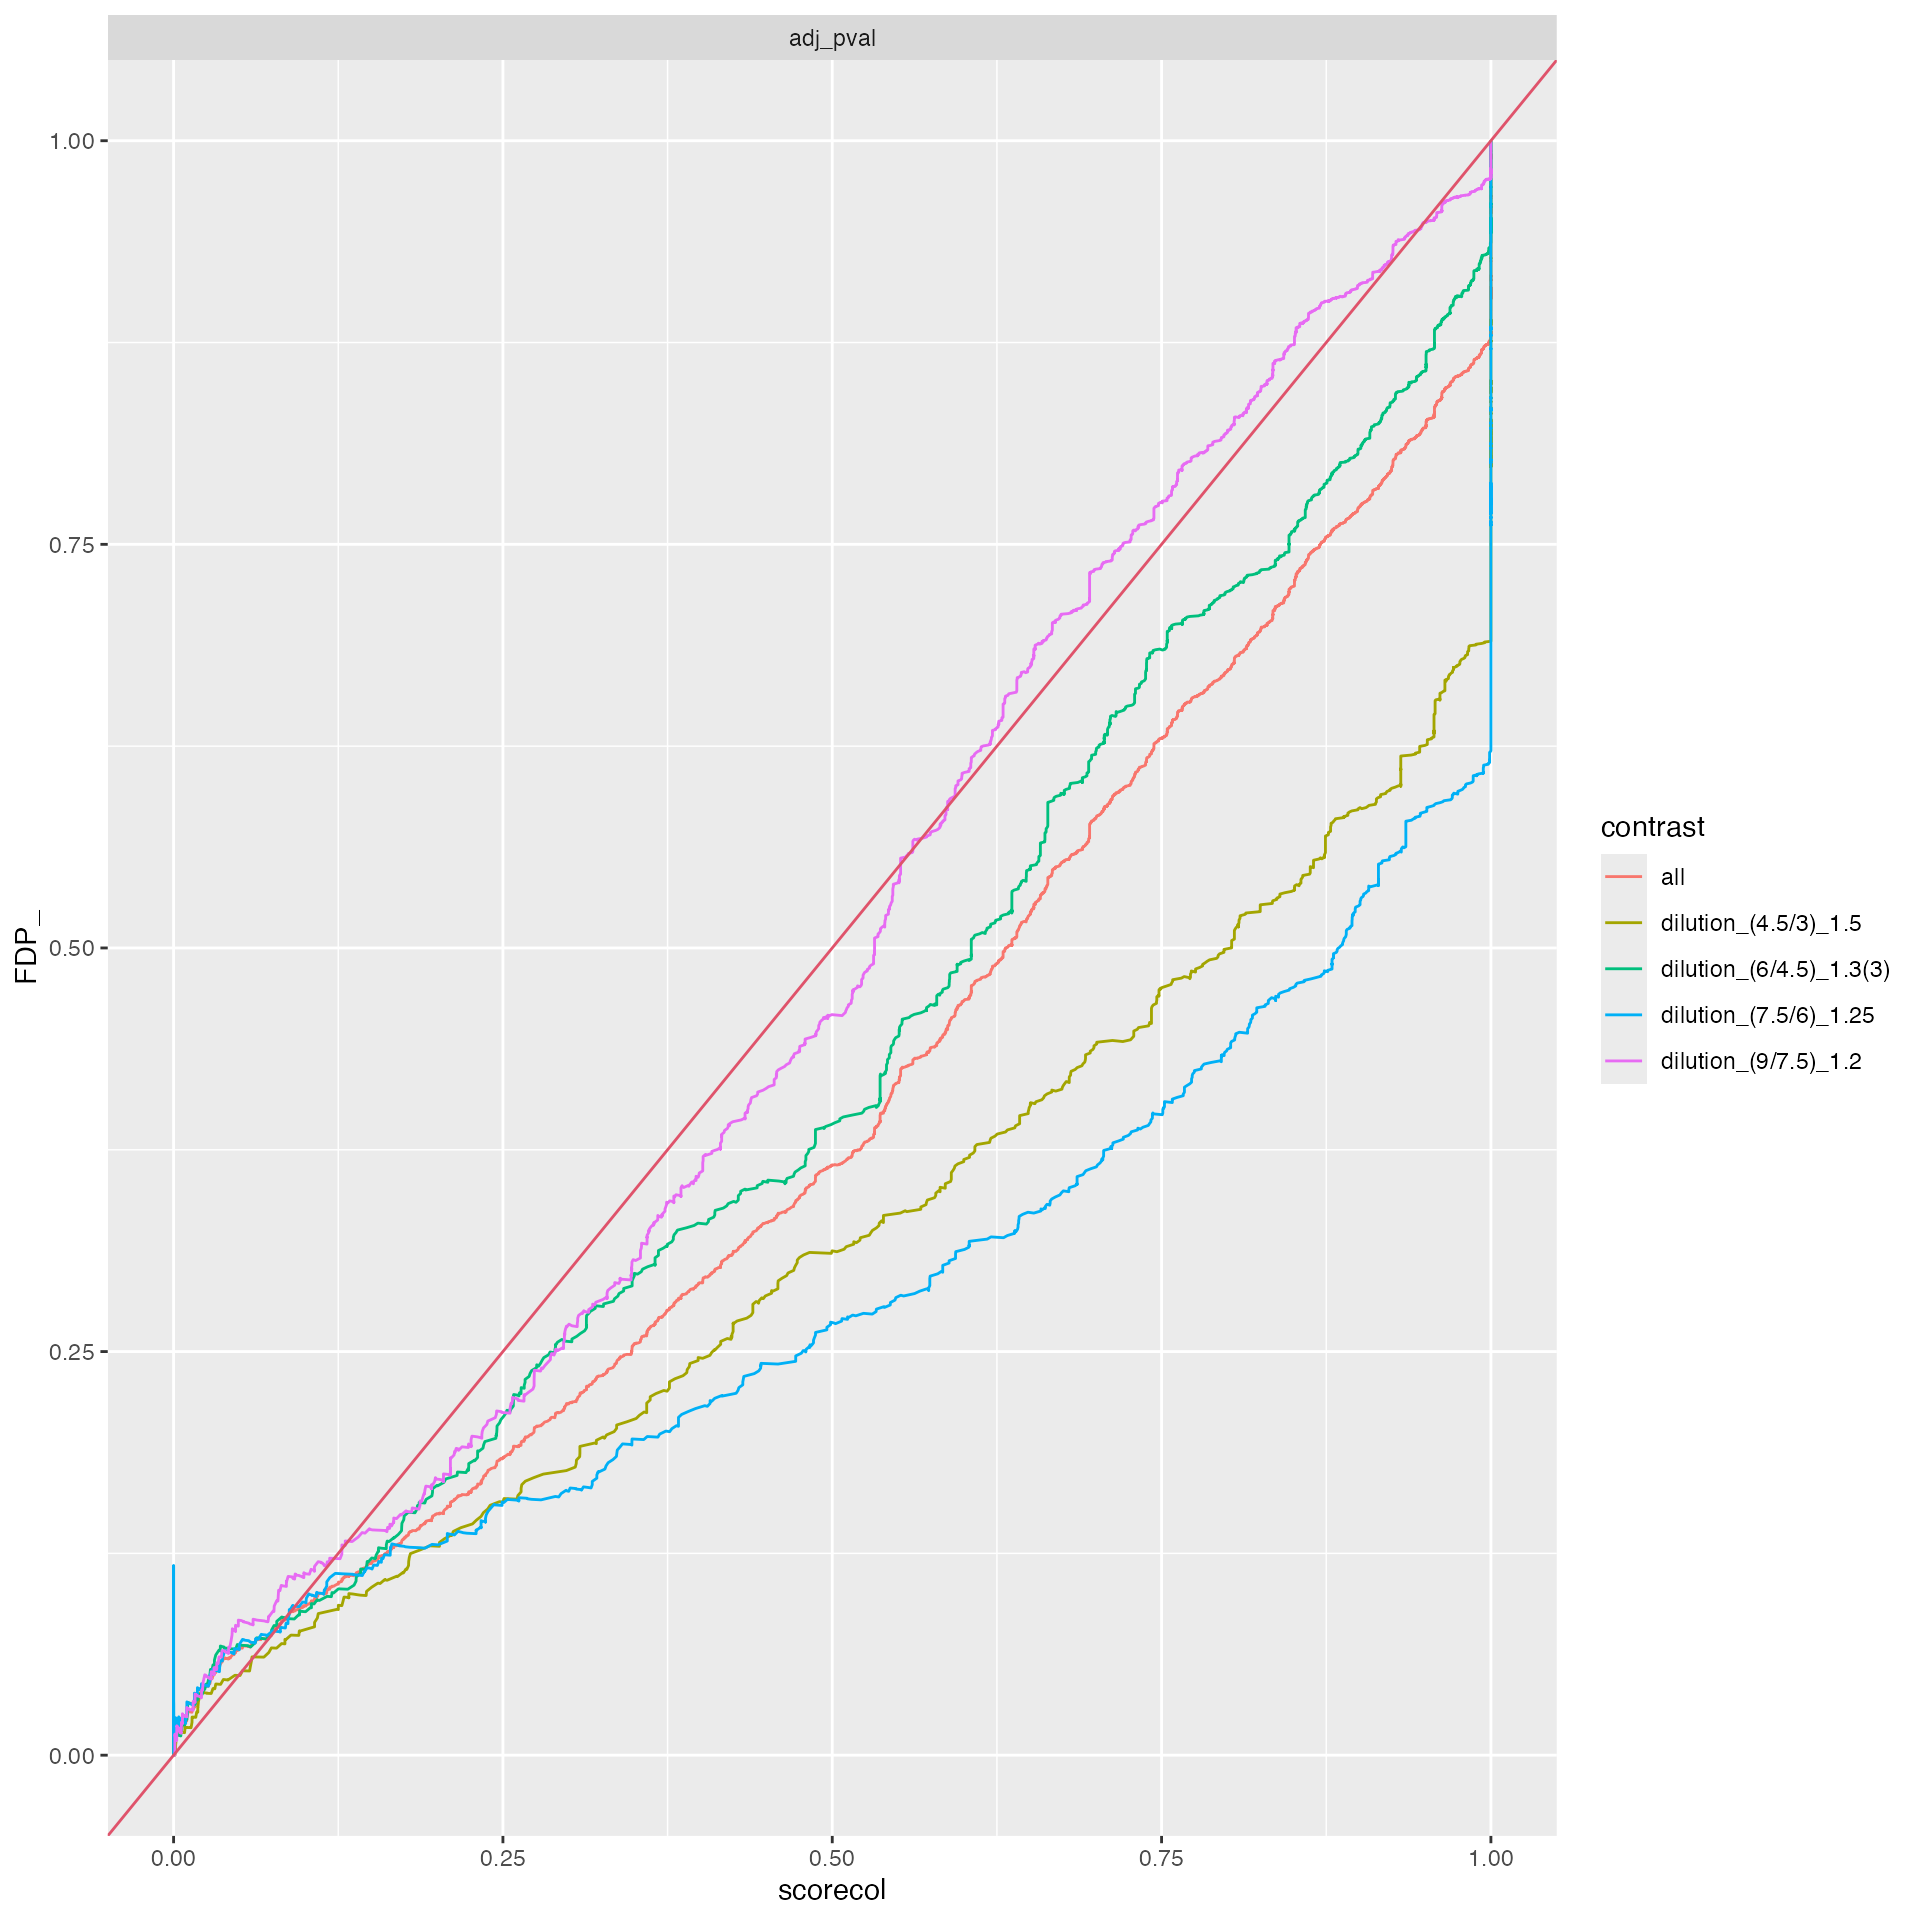
Compare prolfqua and proda
Direct comparison with msqrob2 is impossible since, to fit the
dropout model, the peptide intensities are required, while here, we are
starting the analysis from the combined_proteins.tsv
file.
bdir <- file.path("../inst/Benchresults/",format( Sys.Date(), "%Y%m%d"))
if (!dir.exists(bdir)) {dir.create(bdir)}
saveRDS(list(benchmark_proDA = benchmark_proDA, benchmark_prolfqua = benchmark_prolfqua)
,file.path("../inst/Benchresults/",format( Sys.Date(), "%Y%m%d"),"FragPipev14_comb_prot.RDS"))
proda <- benchmark_proDA$pAUC_summaries()$ftable$content
proda$package <- "proda"
prolfqua <- benchmark_prolfqua$pAUC_summaries()$ftable$content
prolfqua$package <- "prolfqua"
tmp <- dplyr::bind_rows(proda, prolfqua)
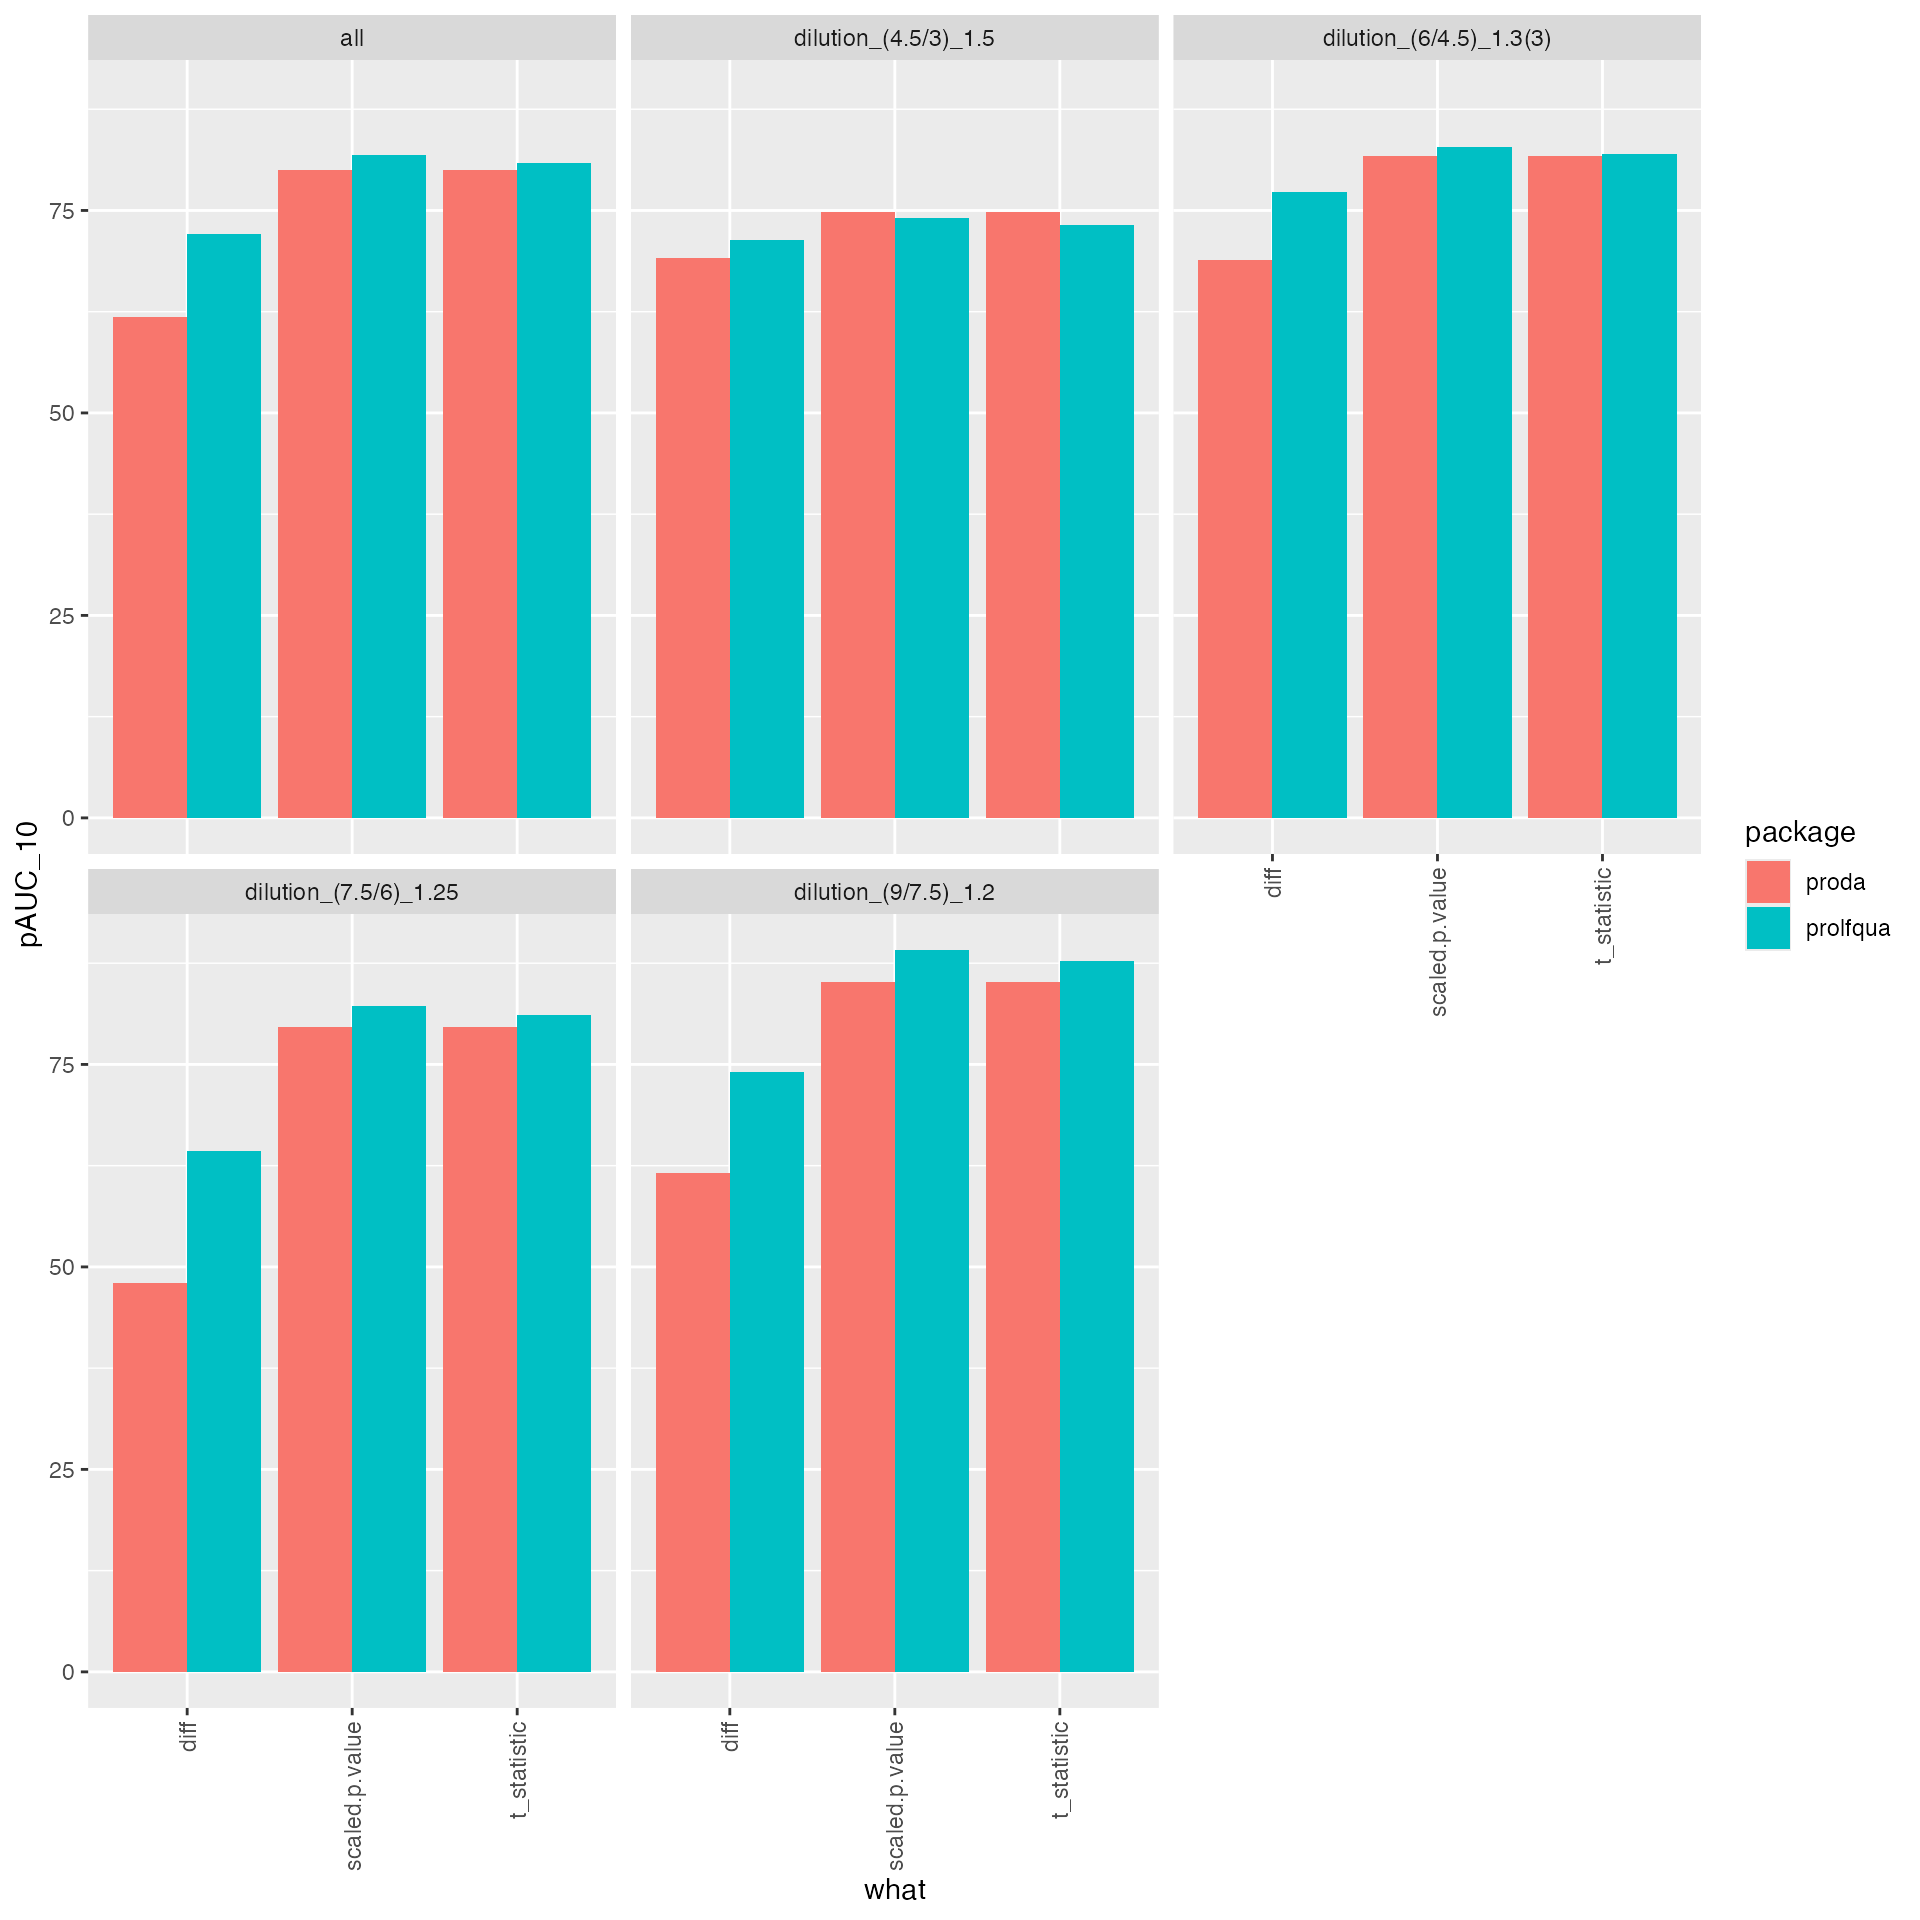
tmp$what |> unique()## [1] "diff" "scaled.pval" "t_statistic" "scaled.p.value"
## [5] "statistic"
tmp$what[tmp$what == "statistic"] <- "t_statistic"
tmp$what[tmp$what == "scaled.pval"] <- "scaled.p.value"

tmp |> ggplot2::ggplot(ggplot2::aes(x = what, y = pAUC_10, group = package, color = NULL, fill = package)) +
  ggplot2::geom_bar(stat = "identity",  position = ggplot2::position_dodge()) +
  ggplot2::facet_wrap(~ contrast) +
  ggplot2::theme(axis.text.x = ggplot2::element_text(angle = 90, vjust = 0.5, hjust = 1))