Benchmarking MSstats DEA using the Ionstar Dataset/MaxQuant
Witold E Wolski
2025-01-09
Source:vignettes/Benchmark_MSStats.Rmd
Benchmark_MSStats.RmdSetting up analysis
## Error in get(paste0(generic, ".", class), envir = get_method_env()) :
##   object 'type_sum.accel' not found
storeBench <- TRUE & evalAllThe following code reads the data and creates and MSStats compatible annotation file.
# Read in MaxQuant files
datadir <- file.path(find.package("prolfquadata") , "quantdata")
inputMQfile <-  file.path(datadir,
                          "MAXQuant_IonStar2018_PXD003881.zip")
inputAnnotation <- file.path(datadir, "annotation_Ionstar2018_PXD003881.xlsx")


proteinGroups <- read.table(unz(inputMQfile,"proteinGroups.txt"), sep = "\t", header = TRUE)
infile <- read.table(unz(inputMQfile,"evidence.txt"), sep = "\t", header = TRUE)

annotation <- readxl::read_xlsx(inputAnnotation)
msstas_annotation <- annotation |> dplyr::select(raw.file, Condition = sample, BioReplicate = run_ID)
msstas_annotation$IsotopeLabelType <- "L"
msstas_annotation <- msstas_annotation |> tidyr::unite("Experiment", Condition, BioReplicate, sep="_", remove = FALSE)
# Read in annotation including condition and biological replicates per run.
# Users should make this annotation file. It is not the output from MaxQuant.

rf <- unique(infile$Raw.file)
rf <- data.frame(Raw.file = rf, raw.file = tolower(rf))
msstas_annotation <- dplyr::inner_join(rf, msstas_annotation)
msstas_annotation$raw.file <- NULL
raw <- MSstats::MaxQtoMSstatsFormat(evidence = infile,
                                    annotation = msstas_annotation,
                                    proteinGroups = proteinGroups,
                                    removeProtein_with1Peptide = TRUE,
                                    use_log_file = FALSE,
                                    verbose = FALSE)
Remove reverse sequence and contaminants.
invisible(utils::capture.output(
  QuantData <- MSstats::dataProcess(raw3, use_log_file = FALSE, verbose = FALSE)
  ))
# Profile plot
#dataProcessPlots(data=QuantData, type = "ProfilePlot")
# Quality control plot
#dataProcessPlots(data=QuantData, type = "QCPlot")
# Quantification plot for conditions
#dataProcessPlots(data=QuantData, type = "ConditionPlot")
Defining Contrasts and computing group comparisons
levels(QuantData$ProcessedData$GROUP_ORIGINAL)## NULL
# based on multiple comparisons  (T1 vs T3; T1 vs T7; T1 vs T9)
comparison1 <- matrix(c(0,0,0,-1,1),nrow = 1)
comparison2 <- matrix(c(0,0,-1,1,0),nrow = 1)
comparison3 <- matrix(c(0,-1,1,0,0),nrow = 1)
comparison4 <- matrix(c(-1,1,0,0,0),nrow = 1)
comparison <- rbind(comparison1,comparison2, comparison3, comparison4)
row.names(comparison) <- c("dilution_(9/7.5)_1.2","dilution_(7.5/6)_1.25","dilution_(6/4.5)_1.3(3)","dilution_(4.5/3)_1.5")
colnames(comparison) <- c("a","b","c","d","e")
invisible(utils::capture.output(
  testResultMultiComparisons <- MSstats::groupComparison(
    contrast.matrix = comparison,
    data = QuantData,
    verbose = FALSE,
    use_log_file = FALSE)
  ))

bb <- testResultMultiComparisons$ComparisonResult
Benchmarking
library(prolfqua)


ttd <- prolfqua::ionstar_bench_preprocess(bb, idcol = "Protein")

benchmark_msstats <- prolfqua::make_benchmark(
    ttd$data,
    contrast = "Label",
    toscale = c("pvalue"),
    fcestimate = "log2FC",
    benchmark = list(
        list(score = "log2FC", desc = TRUE),
        list(score = "Tvalue", desc = TRUE),
        list(score = "scaled.pvalue", desc = TRUE)
    ),
    model_description = "MSStats",
    model_name = "MSStats",
    FDRvsFDP = list(list(score = "adj.pvalue", desc = FALSE))
    , hierarchy = c("Protein"), summarizeNA = "Tvalue"
)
sum(benchmark_msstats$smc$summary$Protein)
## [1] 4029
sumarry <- benchmark_msstats$smc$summary
prolfqua::table_facade(sumarry, caption = "nr of proteins with 0, 1, 2, 3 missing contrasts.")| nr_missing | Protein |
|---|---|
| 0 | 3971 |
| 1 | 40 |
| 2 | 16 |
| 3 | 2 |
res <- benchmark_msstats$pAUC_summaries()
res$barp
ROC curves
#res$ftable
benchmark_msstats$plot_ROC(xlim = 0.2)
plot ROC curves
benchmark_msstats$plot_FDRvsFDP()
plot FDR vs FDP
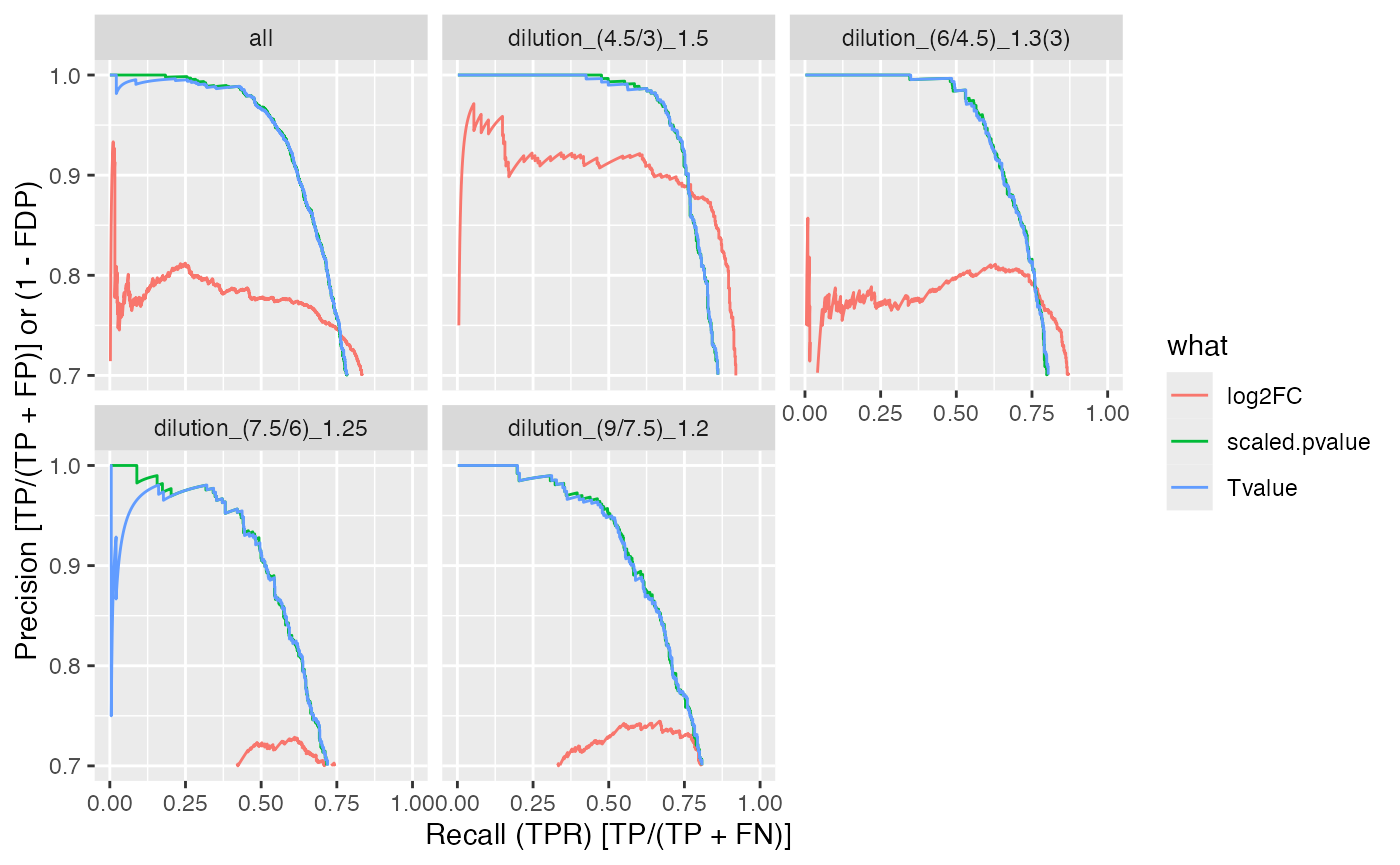
benchmark_msstats$plot_precision_recall()
Precision recall curve.