Benchmarking the msqrob2 package using the Ionstar Dataset starting from peptides.txt
Witold E. Wolski
2026-02-25
Source:vignettes/BenchmarkMSqRob2.Rmd
BenchmarkMSqRob2.Rmd##
## Attaching package: 'dplyr'## The following objects are masked from 'package:stats':
##
## filter, lag## The following objects are masked from 'package:base':
##
## intersect, setdiff, setequal, union## Loading required package: MultiAssayExperiment## Loading required package: SummarizedExperiment## Loading required package: MatrixGenerics## Loading required package: matrixStats##
## Attaching package: 'matrixStats'## The following object is masked from 'package:dplyr':
##
## count##
## Attaching package: 'MatrixGenerics'## The following objects are masked from 'package:matrixStats':
##
## colAlls, colAnyNAs, colAnys, colAvgsPerRowSet, colCollapse,
## colCounts, colCummaxs, colCummins, colCumprods, colCumsums,
## colDiffs, colIQRDiffs, colIQRs, colLogSumExps, colMadDiffs,
## colMads, colMaxs, colMeans2, colMedians, colMins, colOrderStats,
## colProds, colQuantiles, colRanges, colRanks, colSdDiffs, colSds,
## colSums2, colTabulates, colVarDiffs, colVars, colWeightedMads,
## colWeightedMeans, colWeightedMedians, colWeightedSds,
## colWeightedVars, rowAlls, rowAnyNAs, rowAnys, rowAvgsPerColSet,
## rowCollapse, rowCounts, rowCummaxs, rowCummins, rowCumprods,
## rowCumsums, rowDiffs, rowIQRDiffs, rowIQRs, rowLogSumExps,
## rowMadDiffs, rowMads, rowMaxs, rowMeans2, rowMedians, rowMins,
## rowOrderStats, rowProds, rowQuantiles, rowRanges, rowRanks,
## rowSdDiffs, rowSds, rowSums2, rowTabulates, rowVarDiffs, rowVars,
## rowWeightedMads, rowWeightedMeans, rowWeightedMedians,
## rowWeightedSds, rowWeightedVars## Loading required package: GenomicRanges## Loading required package: stats4## Loading required package: BiocGenerics## Loading required package: generics##
## Attaching package: 'generics'## The following object is masked from 'package:dplyr':
##
## explain## The following objects are masked from 'package:base':
##
## as.difftime, as.factor, as.ordered, intersect, is.element, setdiff,
## setequal, union##
## Attaching package: 'BiocGenerics'## The following object is masked from 'package:limma':
##
## plotMA## The following object is masked from 'package:dplyr':
##
## combine## The following objects are masked from 'package:stats':
##
## IQR, mad, sd, var, xtabs## The following objects are masked from 'package:base':
##
## anyDuplicated, aperm, append, as.data.frame, basename, cbind,
## colnames, dirname, do.call, duplicated, eval, evalq, Filter, Find,
## get, grep, grepl, is.unsorted, lapply, Map, mapply, match, mget,
## order, paste, pmax, pmax.int, pmin, pmin.int, Position, rank,
## rbind, Reduce, rownames, sapply, saveRDS, table, tapply, unique,
## unsplit, which.max, which.min## Loading required package: S4Vectors##
## Attaching package: 'S4Vectors'## The following object is masked from 'package:tidyr':
##
## expand## The following objects are masked from 'package:dplyr':
##
## first, rename## The following object is masked from 'package:utils':
##
## findMatches## The following objects are masked from 'package:base':
##
## expand.grid, I, unname## Loading required package: IRanges##
## Attaching package: 'IRanges'## The following objects are masked from 'package:dplyr':
##
## collapse, desc, slice## Loading required package: Seqinfo## Loading required package: Biobase## Welcome to Bioconductor
##
## Vignettes contain introductory material; view with
## 'browseVignettes()'. To cite Bioconductor, see
## 'citation("Biobase")', and for packages 'citation("pkgname")'.##
## Attaching package: 'Biobase'## The following object is masked from 'package:MatrixGenerics':
##
## rowMedians## The following objects are masked from 'package:matrixStats':
##
## anyMissing, rowMedians## Warning: replacing previous import 'S4Arrays::makeNindexFromArrayViewport' by
## 'DelayedArray::makeNindexFromArrayViewport' when loading 'SummarizedExperiment'##
## Attaching package: 'QFeatures'## The following object is masked from 'package:base':
##
## sweep##
## Attaching package: 'plotly'## The following object is masked from 'package:IRanges':
##
## slice## The following object is masked from 'package:S4Vectors':
##
## rename## The following object is masked from 'package:ggplot2':
##
## last_plot## The following object is masked from 'package:stats':
##
## filter## The following object is masked from 'package:graphics':
##
## layout
library(gridExtra)##
## Attaching package: 'gridExtra'## The following object is masked from 'package:Biobase':
##
## combine## The following object is masked from 'package:BiocGenerics':
##
## combine## The following object is masked from 'package:dplyr':
##
## combine
knitr::opts_chunk$set(echo = TRUE, warning = FALSE, message = FALSE)
evalAll <- require(proDA)
## Loading required package: proDA
SAVE = TRUEHere we benchmark the msqrob2 package using the
peptide.txt intensities and median polish
We will be examining the msqrobHurdle method, which does
produce inference using rlm from protein intensity
estimates and uses glm to obtain estimates in those cases
where no estimates are found.
datadir <- file.path(find.package("prolfquadata") , "quantdata")
inputMQfile <-  file.path(datadir,
                          "MAXQuant_IonStar2018_PXD003881.zip")
inputAnnotation <- file.path(datadir, "annotation_Ionstar2018_PXD003881.xlsx")
mqdata <- list()
mqdata$data <- prolfquapp::tidyMQ_Peptides(inputMQfile)
length(unique(mqdata$data$proteins))
## [1] 5295
mqdata$config <- prolfqua::create_config_MQ_peptide()

annotation <- readxl::read_xlsx(inputAnnotation)

data <- dplyr::inner_join(
  mqdata$data,
  annotation,
  by = "raw.file"
)

mqdata$config$table$factors[["dilution."]] = "sample"
mqdata$config$table$factors[["run_Id"]] = "run_ID"
mqdata$config$table$factorDepth <- 1
mqdata$data <- prolfqua::setup_analysis(data, mqdata$config)


lfqdata <- prolfqua::LFQData$new(mqdata$data, mqdata$config)
Filter the data for small intensities (maxquant reports missing values as 0) and for two peptides per protein.
lfqdata$data <- lfqdata$data |> dplyr::filter(!grepl("^REV__|^CON__", protein_Id))
lfqdata$filter_proteins_by_peptide_count()
lfqdata$remove_small_intensities()
lfqdata$hierarchy_counts()
## # A tibble: 1 × 3
## isotope protein_Id peptide_Id
## <chr> <int> <int>
## 1 light 4178 29879
tr <- lfqdata$get_Transformer()
subset_h <- lfqdata$get_copy()
subset_h$data <- subset_h$data |> dplyr::filter(grepl("HUMAN", protein_Id))
subset_h <- subset_h$get_Transformer()$log2()$lfq
lfqdataNormalized <- tr$log2()$robscale_subset(lfqsubset = subset_h)$lfq
lfqAggMedpol <- lfqdataNormalized$get_Aggregator()
lfqAggMedpol$medpolish()
lfqtrans <- lfqAggMedpol$lfq_agg
st <- lfqtrans$get_Stats()
protAbundanceIngroup <- st$stats()
protAbundanceIngroup <- protAbundanceIngroup |>
  tidyr::pivot_wider(
    id_cols = protein_Id,
    names_from = dilution.,
    names_prefix = "abd.",
    values_from = meanAbundance)
To use proDA, we need to create an
SummarizedExperiment. We use the to_wide
function of prolfqua to get the data in in the
SummarizedExperiment compatible format.
Defining Contrasts and computing group comparisons
As usual, two steps are required, first fit the models, then compute the contrasts.
prlm <- msqrobHurdle(pe,
                     i = "protein",
                     formula = ~dilution.,
                     overwrite = TRUE)
Since msqrob does not report average abundances, we are computing them for each contrast.
L <- makeContrast(c("dilution.e-dilution.d=0",
                    "dilution.d-dilution.c=0",
                    "dilution.c-dilution.b=0",
                    "dilution.b=0"),
                  parameterNames = c("dilution.e",
                                     "dilution.d",
                                     "dilution.c",
                                     "dilution.b"))
prlm <- hypothesisTestHurdle(prlm, i = "protein", L, overwrite = TRUE)
protAbundanceIngroup <- protAbundanceIngroup |> dplyr::mutate( avgAbd.e.d =  mean( c(abd.e,abd.d), na.rm = TRUE)  )
protAbundanceIngroup <- protAbundanceIngroup |> dplyr::mutate( avgAbd.d.c =  mean( c(abd.d,abd.c), na.rm = TRUE)  )
protAbundanceIngroup <- protAbundanceIngroup |> dplyr::mutate( avgAbd.c.b =  mean( c(abd.c,abd.b), na.rm = TRUE)  )
protAbundanceIngroup <- protAbundanceIngroup |> dplyr::mutate( avgAbd.b.a =  mean( c(abd.b,abd.a), na.rm = TRUE)  )


xx <- rowData(prlm[["protein"]])
hurdle <- xx[grepl("hurdle_",names(xx))]

res <- list()
for (i in names(hurdle)) {
  hurdle[[i]]$contrast <- i
  res[[i]] <- prolfqua::matrix_to_tibble(hurdle[[i]], preserve_row_names = "name")
}

hurdle <- dplyr::bind_rows(res)
Now we need to merge the results of both models msqrobHurdleIntensity
and msqrobHurdleCount. To find out which models were not estimated by
msqrobHurdleIntensity we check for NA’s and use the
anti_join to select those from the
msqrobHurdleCount models.
logFC <- hurdle |> dplyr::select("name","contrast", starts_with("logFC"))
logFC <- filter(logFC ,!is.na(logFCt))
logFC$modelName <- "msqrobHurdleIntensity"
names(logFC) <- c("name","contrast","logFC","se","df","t","pval","modelName")

logOR <- hurdle |> dplyr::select("name","contrast", starts_with("logOR"))
logOR$modelName <- "msqrobHurdleCount"
names(logOR) <- c("name","contrast","logFC","se","df","t","pval","modelName")


ddd <- dplyr::anti_join(logOR , logFC, by = c("name", "contrast"))
all <- dplyr::bind_rows(ddd , logFC) |> dplyr::arrange(contrast, name)
all <- prolfqua::adjust_p_values(all, column = "pval", group_by_col = "contrast")
all$contrast |> unique()
## [1] "hurdle_dilution.b" "hurdle_dilution.c - dilution.b"
## [3] "hurdle_dilution.d - dilution.c" "hurdle_dilution.e - dilution.d"
protAbundanceIngroup <- protAbundanceIngroup |>
  dplyr::select(-starts_with("abd")) |>
  tidyr::pivot_longer(starts_with("avgAbd"), names_to = "contrast" ,values_to = "avgAbd")

protAbundanceIngroup <- protAbundanceIngroup |>
  mutate(contrast =
           case_when(contrast == "avgAbd.e.d" ~ "dilution_(9/7.5)_1.2",
                     contrast == "avgAbd.d.c" ~ "dilution_(7.5/6)_1.25",
                     contrast == "avgAbd.c.b" ~ "dilution_(6/4.5)_1.3(3)",
                     contrast == "avgAbd.b.a" ~ "dilution_(4.5/3)_1.5",
                     TRUE ~ "something wrong"))
all <- all |> mutate(contrast = case_when(
  contrast == "hurdle_dilution.e - dilution.d" ~ "dilution_(9/7.5)_1.2",
  contrast == "hurdle_dilution.d - dilution.c" ~ "dilution_(7.5/6)_1.25",
  contrast == "hurdle_dilution.c - dilution.b" ~ "dilution_(6/4.5)_1.3(3)",
  contrast == "hurdle_dilution.b" ~ "dilution_(4.5/3)_1.5",
  TRUE ~ "something wrong"))
stopifnot(sum(all$contrast == "something wrong") == 0 )
stopifnot(sum(all$contrast == "something wrong") == 0 )


bb <- dplyr::inner_join(all, protAbundanceIngroup, by = c("name" = "protein_Id", "contrast" = "contrast"))
Benchmarking
Here we use proflqua benchmark functions to generate
some summaries.
ttd <- prolfqua::ionstar_bench_preprocess( bb , idcol = "name" )
benchmark_msqrob <- prolfqua::make_benchmark(ttd$data,
                                             contrast = "contrast",
                                             toscale = c("pval"),
                                             fcestimate = "logFC",
                                             benchmark = list(
                                               list(score = "logFC", desc = TRUE),
                                               list(score = "t", desc = TRUE),
                                               list(score = "scaled.pval", desc = TRUE)
                                             ),
                                             model_description = "msqrob_QFeature",
                                             model_name = "msqrob_QFeature",
                                             FDRvsFDP = list(list(score = "FDR", desc = FALSE))
                                             , hierarchy = c("name"), summarizeNA = "t"
)

sumarry <- benchmark_msqrob$smc$summary
prolfqua::table_facade(sumarry, caption = "nr of proteins with 0, 1, 2, 3 missing contrasts.")| nr_missing | name |
|---|---|
| 0 | 4178 |
res <- benchmark_msqrob$pAUC_summaries()
knitr::kable(res$ftable$content,caption = res$ftable$caption)| contrast | what | AUC | pAUC_10 | pAUC_20 |
|---|---|---|---|---|
| all | logFC | 92.63287 | 66.24355 | 78.59378 |
| all | scaled.pval | 93.01805 | 73.14493 | 79.60189 |
| all | t | 92.98342 | 72.89383 | 79.43726 |
| dilution_(4.5/3)_1.5 | logFC | 93.86353 | 79.46174 | 85.68721 |
| dilution_(4.5/3)_1.5 | scaled.pval | 93.72513 | 79.48864 | 83.93109 |
| dilution_(4.5/3)_1.5 | t | 93.68133 | 79.29634 | 83.76018 |
| dilution_(6/4.5)_1.3(3) | logFC | 91.35764 | 64.93820 | 76.98535 |
| dilution_(6/4.5)_1.3(3) | scaled.pval | 91.60019 | 72.43506 | 77.82735 |
| dilution_(6/4.5)_1.3(3) | t | 91.57006 | 72.21011 | 77.69261 |
| dilution_(7.5/6)_1.25 | logFC | 92.34109 | 59.73094 | 75.30708 |
| dilution_(7.5/6)_1.25 | scaled.pval | 92.94002 | 69.21746 | 77.32718 |
| dilution_(7.5/6)_1.25 | t | 92.90169 | 68.93606 | 77.16068 |
| dilution_(9/7.5)_1.2 | logFC | 92.84797 | 60.08203 | 76.25781 |
| dilution_(9/7.5)_1.2 | scaled.pval | 93.74250 | 71.32621 | 79.51400 |
| dilution_(9/7.5)_1.2 | t | 93.71732 | 71.08406 | 79.36228 |
res$barp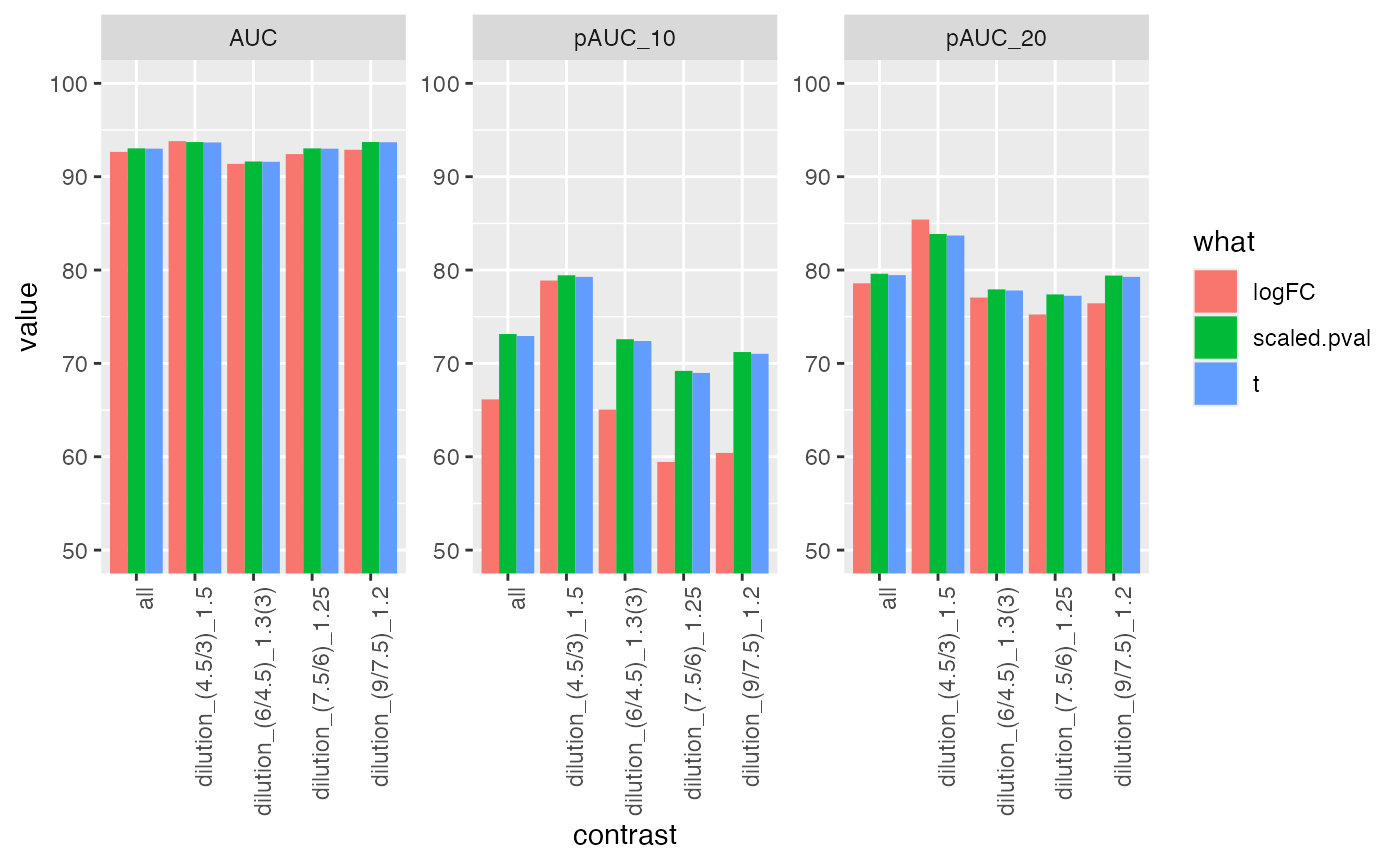
ROC curves
#res$ftable
benchmark_msqrob$plot_ROC(xlim = 0.2)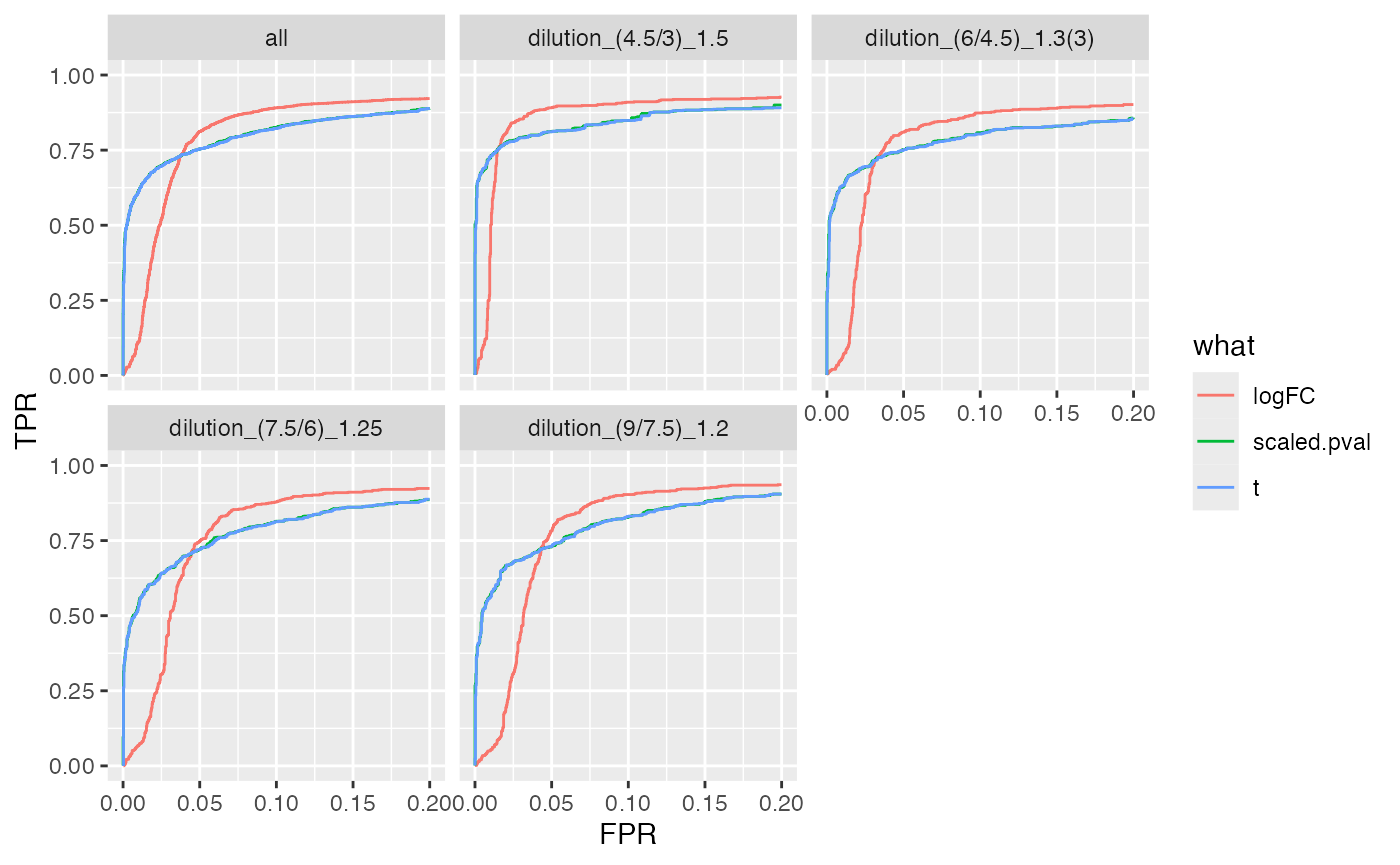
plot ROC curves
benchmark_msqrob$plot_FDRvsFDP()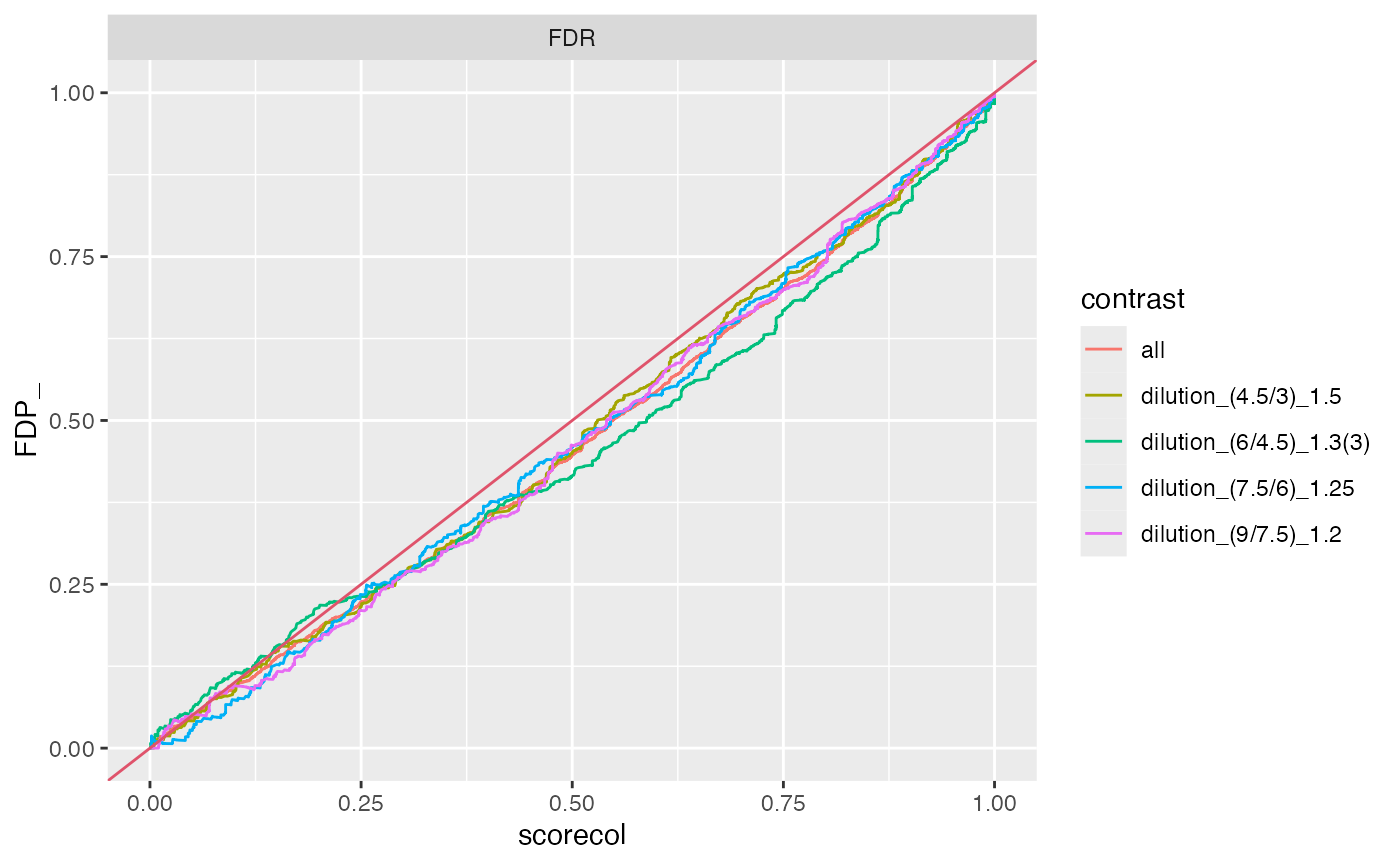
plot FDR vs FDP
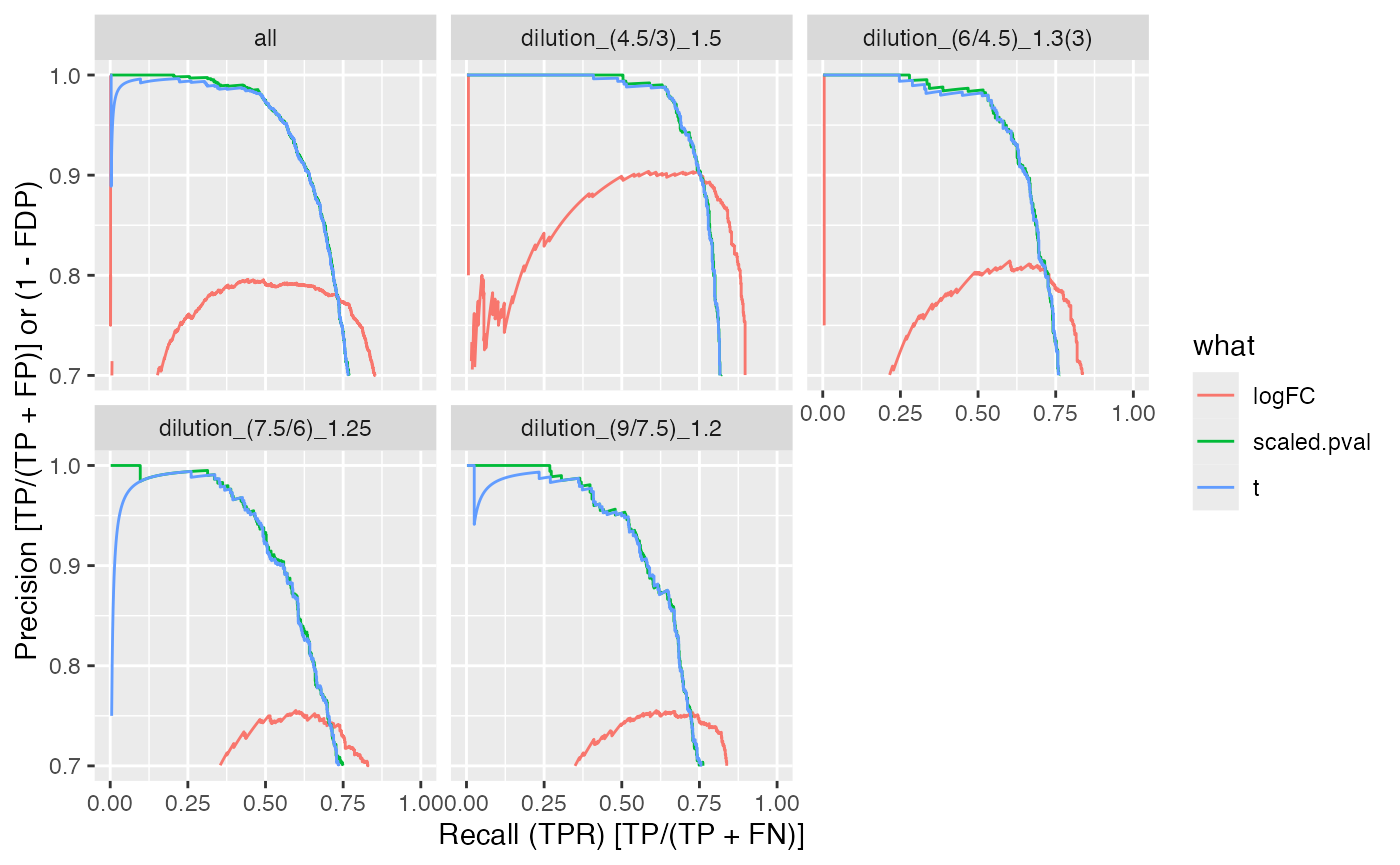
benchmark_msqrob$plot_precision_recall()