Benchmarking the proDA package using the Ionstar Dataset starting from peptides
Witold E Wolski
2026-02-25
Source:vignettes/Benchmark_proDA_medpolish.Rmd
Benchmark_proDA_medpolish.Rmd
knitr::opts_chunk$set(echo = TRUE, warning = FALSE, message = FALSE)
evalAll <- require(proDA)
## Loading required package: proDA## Warning: replacing previous import 'S4Arrays::makeNindexFromArrayViewport' by
## 'DelayedArray::makeNindexFromArrayViewport' when loading 'SummarizedExperiment'
SAVE = TRUEproDA benchmark based on peptide.txt intensities and median polish
datadir <- file.path(find.package("prolfquadata") , "quantdata")
inputMQfile <-  file.path(datadir,
                          "MAXQuant_IonStar2018_PXD003881.zip")
inputAnnotation <- file.path(datadir, "annotation_Ionstar2018_PXD003881.xlsx")
mqdata <- list()
mqdata$data <- prolfquapp::tidyMQ_Peptides(inputMQfile)
length(unique(mqdata$data$proteins))
## [1] 5295
mqdata$config <- prolfqua::create_config_MQ_peptide()

annotation <- readxl::read_xlsx(inputAnnotation)
res <- dplyr::inner_join(
  mqdata$data,
  annotation,
  by = "raw.file"
)

mqdata$config$table$factors[["dilution."]] = "sample"
mqdata$config$table$factors[["run_Id"]] = "run_ID"
mqdata$config$table$factorDepth <- 1
mqdata$data <- prolfqua::setup_analysis(res, mqdata$config)


lfqdata <- prolfqua::LFQData$new(mqdata$data, mqdata$config)
Filter the data for small intensities (maxquant reports missing values as 0) and for two peptides per protein.
lfqdata$data <- lfqdata$data |> dplyr::filter(!grepl("^REV__|^CON__", protein_Id))
lfqdata$filter_proteins_by_peptide_count()
lfqdata$remove_small_intensities()
lfqdata$hierarchy_counts()
## # A tibble: 1 × 3
## isotope protein_Id peptide_Id
## <chr> <int> <int>
## 1 light 4178 29879
tr <- lfqdata$get_Transformer()
subset_h <- lfqdata$get_copy()
subset_h$data <- subset_h$data |> dplyr::filter(grepl("HUMAN", protein_Id))
subset_h <- subset_h$get_Transformer()$log2()$lfq
lfqdataNormalized <- tr$log2()$robscale_subset(lfqsubset = subset_h)$lfq

lfqAggMedpol <- lfqdataNormalized$get_Aggregator()
lfqAggMedpol$medpolish()
lfqtrans <- lfqAggMedpol$lfq_agg
To use proDA, we need to create an
SummarizedExperiment. We use the to_wide
function of prolfqua to get the data in in the
SummarizedExperiment compatible format.
se <- prolfqua::LFQDataToSummarizedExperiment(lfqtrans)Defining Contrasts and computing group comparisons
As usual, two steps are required, first fit the models, then comptue the contrasts.
fit <- proDA::proDA(se, design = ~ dilution. - 1,data_is_log_transformed = TRUE)
contr <- list()
contr[["dilution_(9/7.5)_1.2"]] <- data.frame(
  contrast = "dilution_(9/7.5)_1.2",
  proDA::test_diff(fit, contrast = "dilution.e - dilution.d"))
contr[["dilution_(7.5/6)_1.25"]] <- data.frame(
  contrast = "dilution_(7.5/6)_1.25",
  proDA::test_diff(fit, contrast = "dilution.d - dilution.c"))
contr[["dilution_(6/4.5)_1.3(3)"]] <- data.frame(
  contrast = "dilution_(6/4.5)_1.3(3)",
  proDA::test_diff(fit, contrast = "dilution.c - dilution.b"))
contr[["dilution_(4.5/3)_1.5"]] <- data.frame(
  contrast = "dilution_(4.5/3)_1.5",
  proDA::test_diff(fit, contrast = "dilution.b - dilution.a" ))

bb <- dplyr::bind_rows(contr)
Benchmarking
## [1] 4178
ttd <- prolfqua::ionstar_bench_preprocess( bb , idcol = "name" )

benchmark_proDA <- prolfqua::make_benchmark(ttd$data,
                                            contrast = "contrast",
                                            toscale = c("pval"),
                                            fcestimate = "diff",
                                            benchmark = list(
                                              list(score = "diff", desc = TRUE),
                                              list(score = "t_statistic", desc = TRUE),
                                              list(score = "scaled.pval", desc = TRUE)
                                            ),
                                            model_description = "proDA_medpolishInt",
                                            model_name = "proDA_medpolishInt",
                                            FDRvsFDP = list(list(score = "adj_pval", desc = FALSE))
                                            , hierarchy = c("name"), summarizeNA = "t_statistic"
)

sum(benchmark_proDA$smc$summary$name)
## [1] 4178
sumarry <- benchmark_proDA$smc$summary
prolfqua::table_facade(sumarry, caption = "nr of proteins with 0, 1, 2, 3 missing contrasts.")| nr_missing | name |
|---|---|
| 0 | 4178 |
res <- benchmark_proDA$pAUC_summaries()
knitr::kable(res$ftable$content,caption = res$ftable$caption)| contrast | what | AUC | pAUC_10 | pAUC_20 |
|---|---|---|---|---|
| all | diff | 92.87053 | 66.41728 | 78.70537 |
| all | scaled.pval | 92.98468 | 72.56057 | 79.12655 |
| all | t_statistic | 92.98468 | 72.56057 | 79.12655 |
| dilution_(4.5/3)_1.5 | diff | 94.61075 | 81.30629 | 86.53539 |
| dilution_(4.5/3)_1.5 | scaled.pval | 94.19275 | 81.52682 | 85.09375 |
| dilution_(4.5/3)_1.5 | t_statistic | 94.19275 | 81.52682 | 85.09375 |
| dilution_(6/4.5)_1.3(3) | diff | 92.05793 | 66.72012 | 78.40185 |
| dilution_(6/4.5)_1.3(3) | scaled.pval | 92.10446 | 72.99654 | 78.92275 |
| dilution_(6/4.5)_1.3(3) | t_statistic | 92.10446 | 72.99654 | 78.92275 |
| dilution_(7.5/6)_1.25 | diff | 91.74331 | 58.59960 | 74.26726 |
| dilution_(7.5/6)_1.25 | scaled.pval | 92.07191 | 67.19030 | 75.01046 |
| dilution_(7.5/6)_1.25 | t_statistic | 92.07191 | 67.19030 | 75.01046 |
| dilution_(9/7.5)_1.2 | diff | 92.94002 | 57.98695 | 75.34788 |
| dilution_(9/7.5)_1.2 | scaled.pval | 93.50830 | 68.18359 | 77.57440 |
| dilution_(9/7.5)_1.2 | t_statistic | 93.50830 | 68.18359 | 77.57440 |
res$barp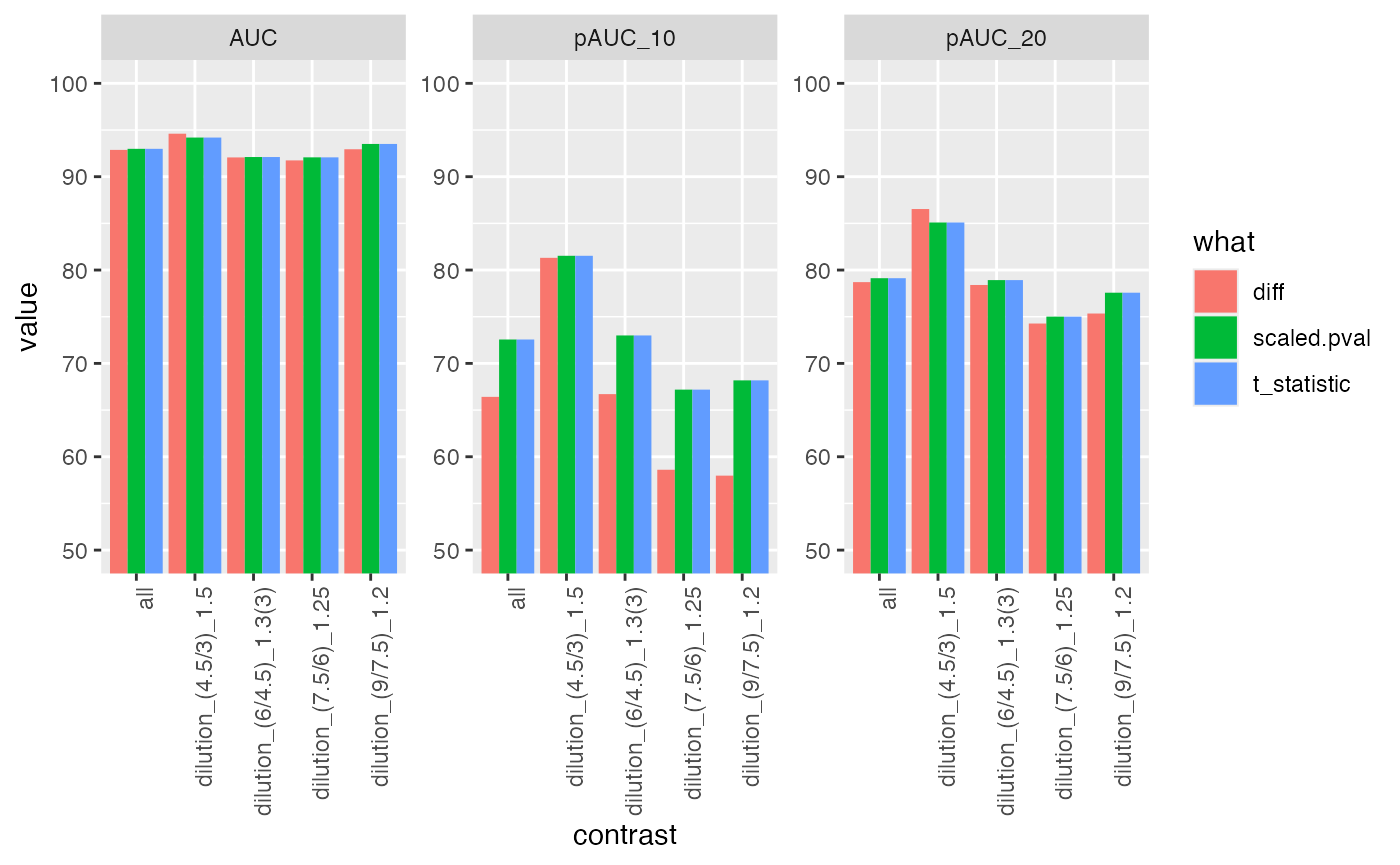
ROC curves
#res$ftable
benchmark_proDA$plot_ROC(xlim = 0.2)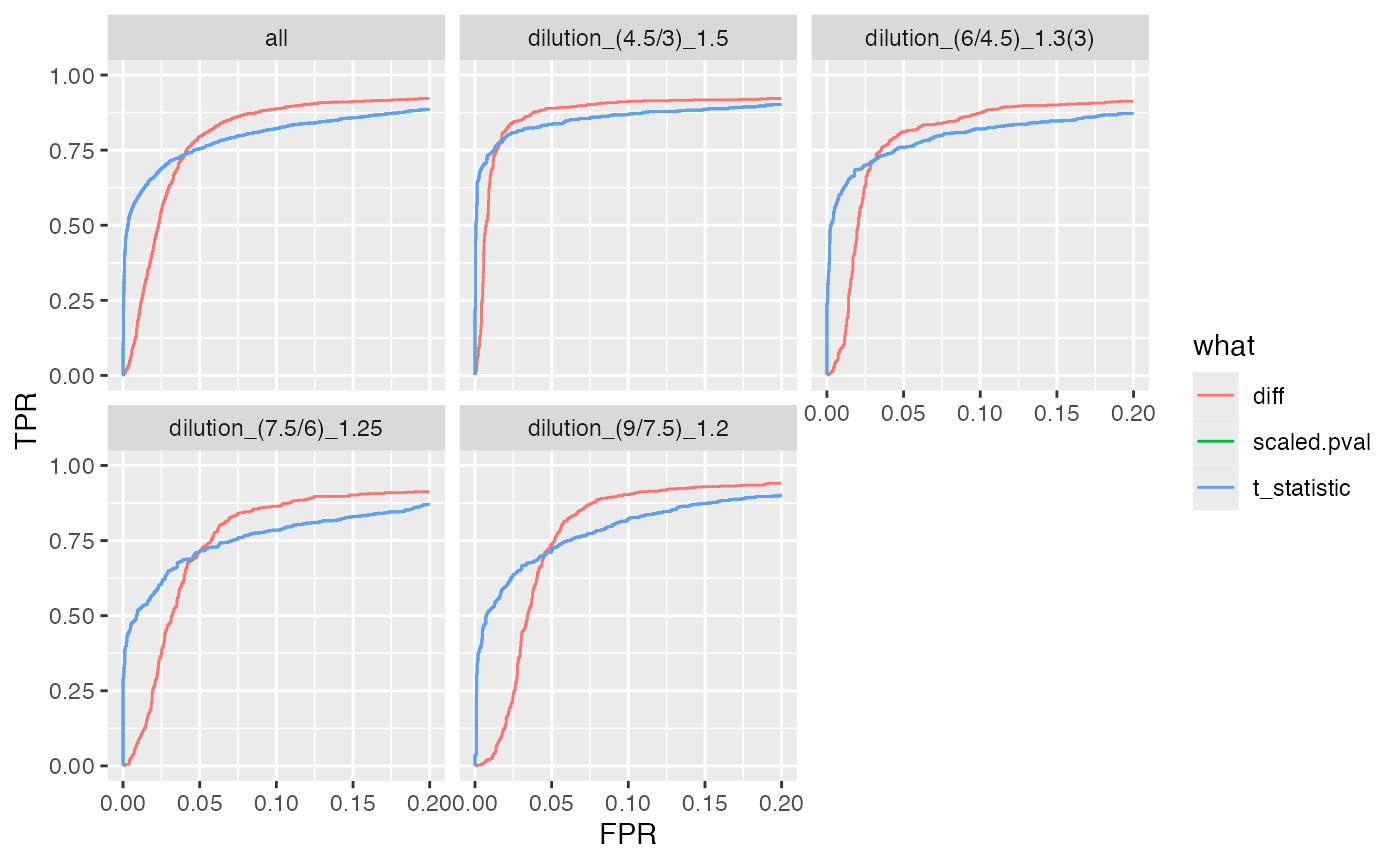
plot ROC curves
benchmark_proDA$plot_FDRvsFDP()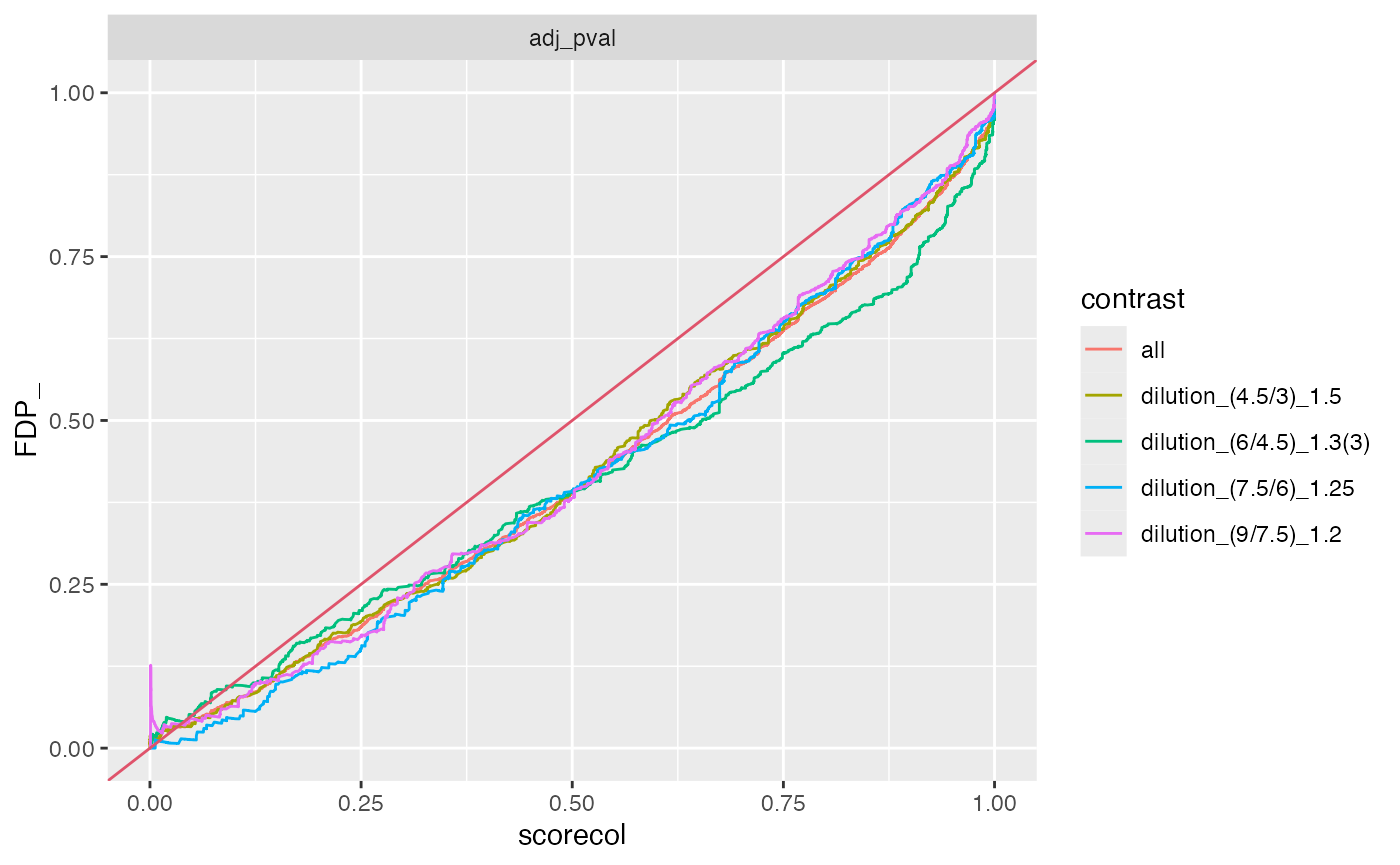
plot FDR vs FDP
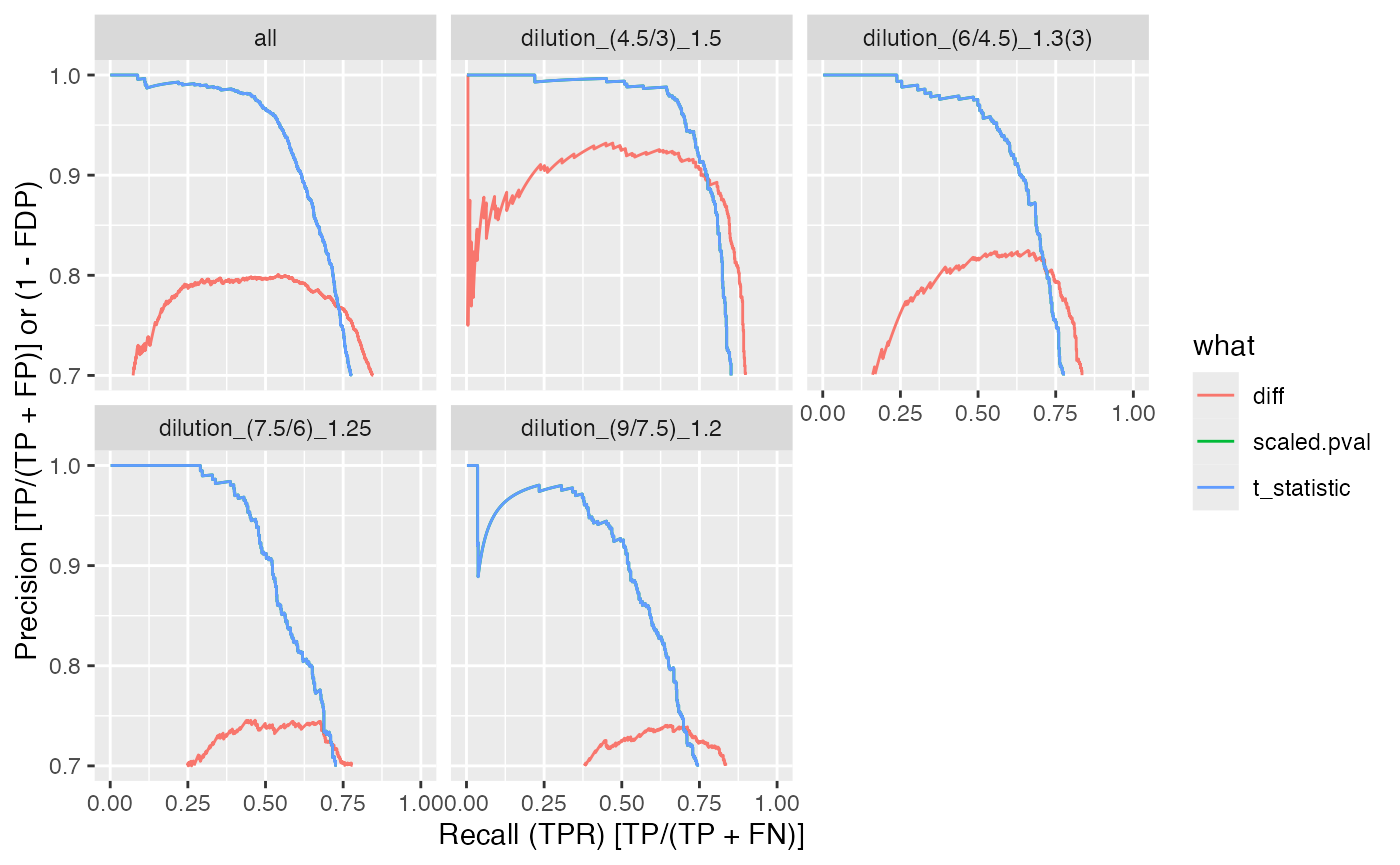
benchmark_proDA$plot_precision_recall()