DEA benchmark CPTAC/MaxQuant/peptide.txt
Witold E. Wolski
2026-02-25
Source:vignettes/Benchmark_cptac.Rmd
Benchmark_cptac.RmdIntroduction
The r-package provides a subset of the data of the 6th study of the Clinical Proteomic Technology Assessment for Cancer (CPTAC). In this experiment, the Sigma Universal Protein Standard mixture 1 (UPS1) containing different human proteins was spiked in a protein background of 60 ng/ Saccharomyces cerevisiae strain BY4741. Two different spike-in concentrations were used, 6A ( fmol UPS1 proteins/) and 6B ( fmol UPS1 proteins/). Three replicates are available for each concentration.
library(dplyr)
library(tidyr)
library(ggplot2)
tmp <- msdata::quant(full.names = TRUE)
xx <- read.csv(tmp, sep = "\t")
peptides <- prolfquapp::tidyMQ_Peptides(xx)

annotation <- data.frame(raw.file = unique(peptides$raw.file))
annotation <- annotation |> dplyr::mutate(group = gsub("^6","",raw.file)) |> mutate(group = gsub("_[0-9]$", "", group))

peptides <- dplyr::inner_join(annotation, peptides)


config <- prolfqua::create_config_MQ_peptide()
config$table$factors["group."] = "group"

peptides <- prolfqua::setup_analysis(peptides, config)
lfqpeptides <- prolfqua::LFQData$new(peptides, config)
lfqpeptides$filter_proteins_by_peptide_count()
lfqpeptides$remove_small_intensities()

lfqpeptides$hierarchy_counts()
## # A tibble: 1 × 3
## isotope protein_Id peptide_Id
## <chr> <int> <int>
## 1 light 1341 7787
lfqpeptides$factors()## # A tibble: 6 × 3
## raw.file sampleName group.
## <chr> <chr> <chr>
## 1 6a_7 6a_7 a
## 2 6a_8 6a_8 a
## 3 6a_9 6a_9 a
## 4 6b_7 6b_7 b
## 5 6b_8 6b_8 b
## 6 6b_9 6b_9 bTransform and Aggregate
First we transform the data using vsn::justvsn function and afterwards we estimate protein intensities using Tukeys median polish.
tr <- lfqpeptides$get_Transformer()
tr <- tr$intensity_matrix(vsn::justvsn)
lfqtransformed <- tr$lfq
agg <- lfqtransformed$get_Aggregator()
agg$medpolish()
pl <- agg$plot()
gridExtra::grid.arrange(grobs = pl$plots[33:38])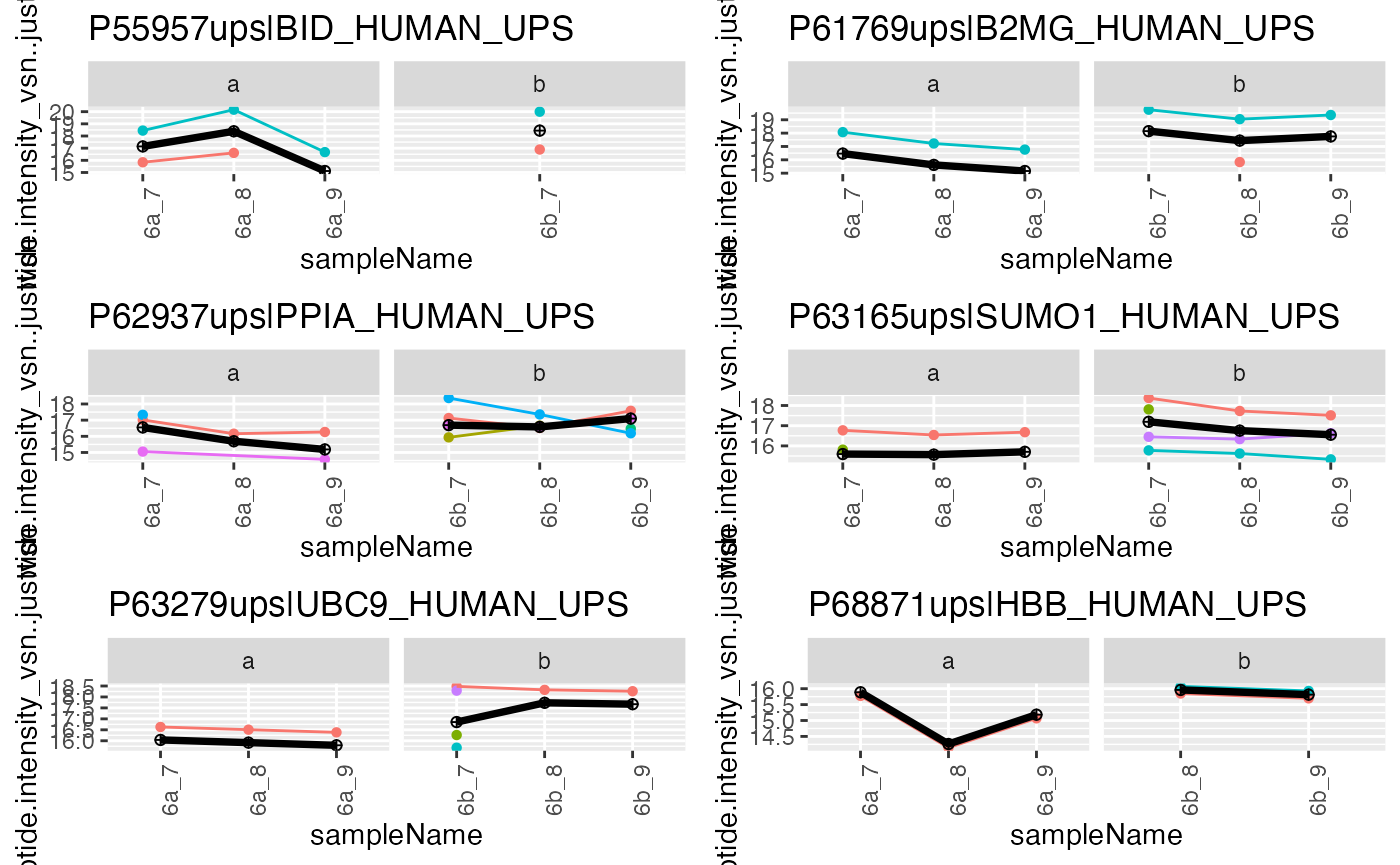
Peptide abundances and protein abundance estimates.
lfqProt <- agg$lfq_aggFit model with prolfqua
library(prolfqua)

model <- paste(lfqProt$response(), " ~ group. ")
lm <- prolfqua::strategy_lm(model)
lmmodl <- prolfqua::build_model(lfqProt, lm)
contrast <- c("b_vs_a" = "group.b - group.a")

clm <- prolfqua::Contrasts$new(lmmodl, contrast)
tt <- clm$get_contrasts()

csimp <- prolfqua::ContrastsMissing$new(lfqProt, contrast)
tt <- csimp$get_contrasts()

merge <- prolfqua::merge_contrasts_results(clm, csimp)
cmod <- ContrastsModerated$new(merge$merge)

pl <- cmod$get_Plotter()
pl$volcano()$FDR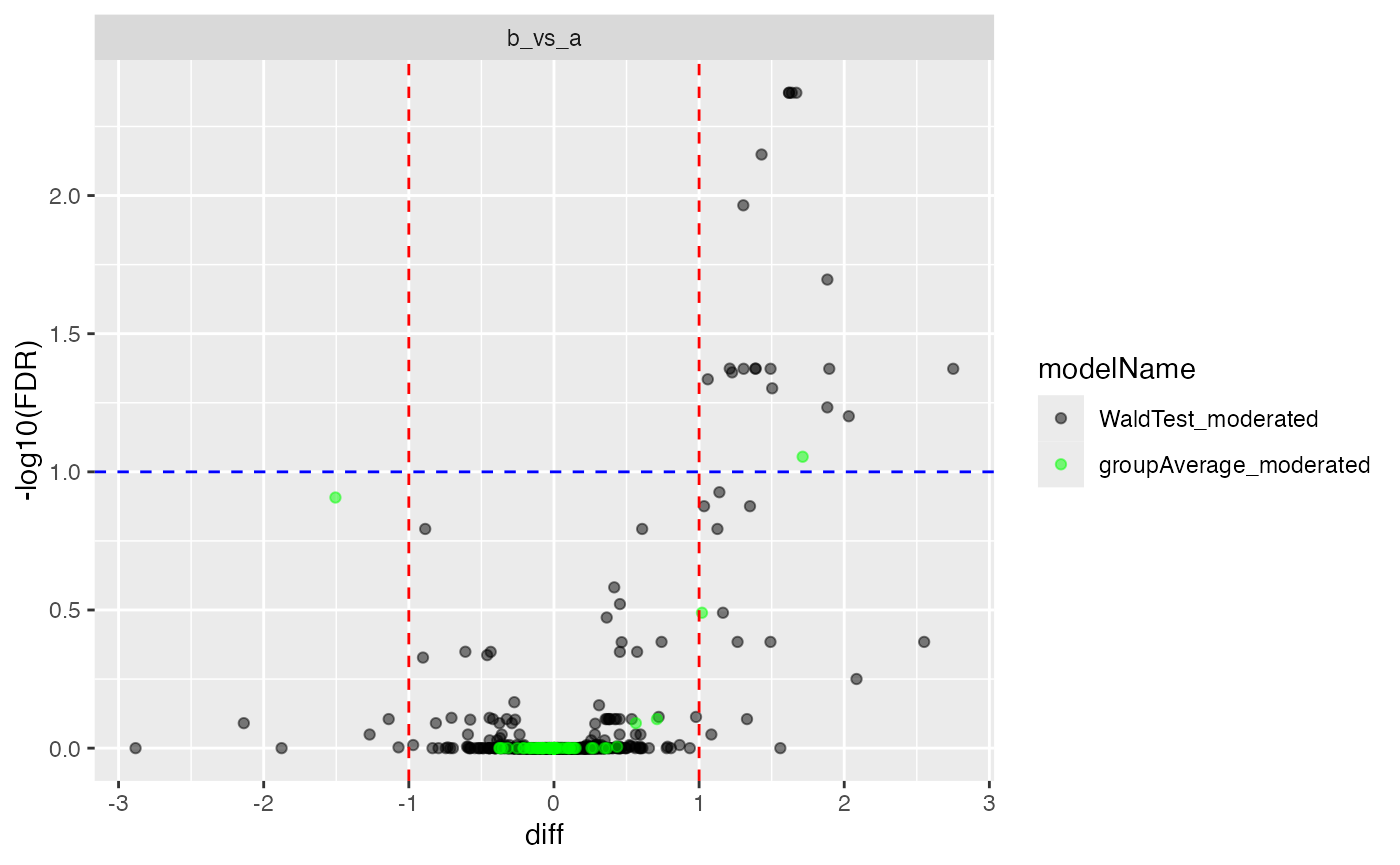
Setting up benchmark. UPS proteins are true positives, while YEAST proteins are true negatives. Contaminants are removed. This leaves 1460 proteins.
ttd <- prolfquabenchmark::cptac_bench_preprocess(cmod$get_contrasts(), idcol = "protein_Id")
benchmark_merged <- prolfqua::make_benchmark(
  ttd$data,
  model_description = "merge of prot moderated and imputed",
  model_name = "prolfqua_merged")


sumarry <- benchmark_merged$smc$summary
knitr::kable(sumarry, caption = "nr of proteins with 0, 1, 2, 3 missing contrasts.",format = "html")| nr_missing | protein_Id |
|---|---|
| 0 | 1332 |
| 1 | 1 |
res <- benchmark_merged$pAUC_summaries()
knitr::kable(res$ftable$content,caption = res$ftable$caption)| contrast | what | AUC | pAUC_10 | pAUC_20 |
|---|---|---|---|---|
| all | diff | 88.17111 | 78.45654 | 79.40988 |
| all | scaled.p.value | 86.41628 | 69.82676 | 73.52024 |
| all | statistic | 86.40494 | 69.58115 | 73.46357 |
| b_vs_a | diff | 88.17111 | 78.45654 | 79.40988 |
| b_vs_a | scaled.p.value | 86.41628 | 69.82676 | 73.52024 |
| b_vs_a | statistic | 86.40494 | 69.58115 | 73.46357 |
res$barp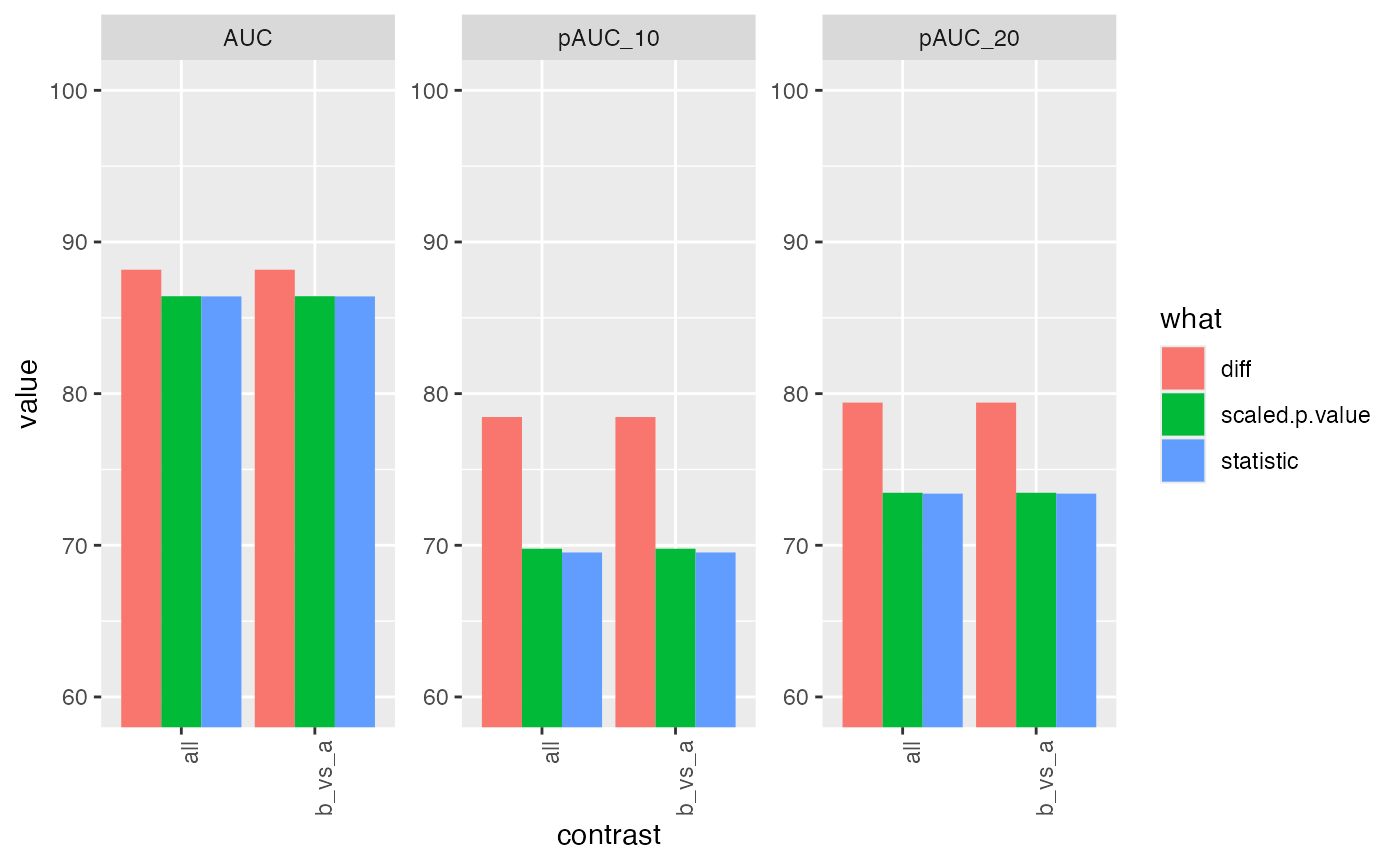
Fit model with proDA
library(prolfqua)
library(proDA)
library(SummarizedExperiment)
se <- prolfqua::LFQDataToSummarizedExperiment(lfqProt)

mm <- model.matrix(~ group., colData(se))
proModel <- proDA::proDA(se, design = mm, data_is_log_transformed = TRUE)
res <- test_diff(proModel, "group.b", sort_by = "pval")
res$contrast = "b_vs_a"
tmp <- prolfqua::ContrastsProDA$new(res, c("a_vs_b" = "group.b - group.a"))
tmp$get_Plotter()$volcano()$adj_pval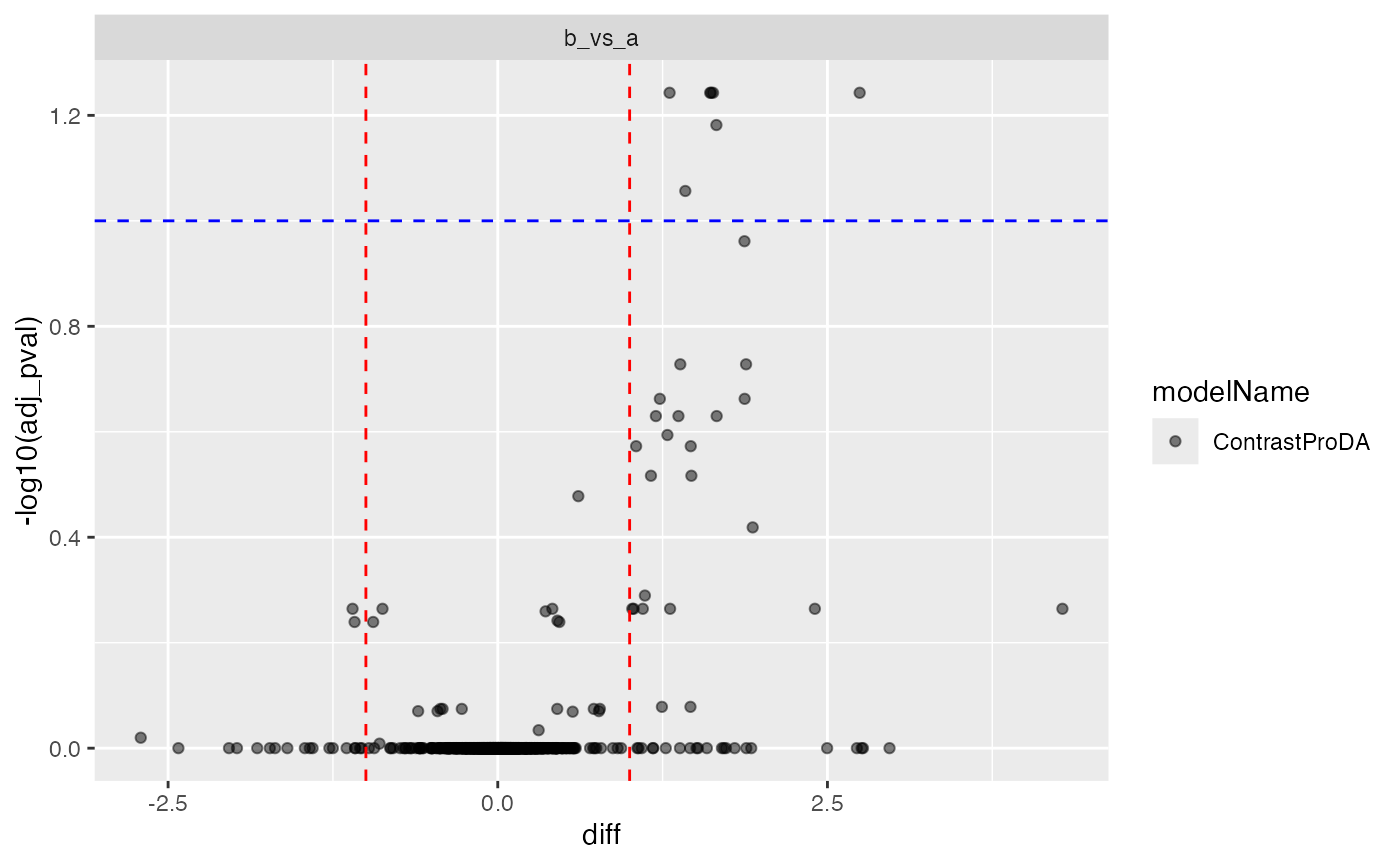
ttd <- prolfquabenchmark::cptac_bench_preprocess(tmp$get_contrasts(), idcol = "name")
benchmark_proDA <- prolfqua::make_benchmark(ttd$data,
                                            contrast = "contrast",
                                            toscale = c("pval"),
                                            fcestimate = "diff",
                                            benchmark = list(
                                              list(score = "diff", desc = TRUE),
                                              list(score = "t_statistic", desc = TRUE),
                                              list(score = "scaled.pval", desc = TRUE)
                                            ),
                                            model_description = "proDA_medpolishInt",
                                            model_name = "proDA_medpolishInt",
                                            FDRvsFDP = list(list(score = "adj_pval", desc = FALSE))
                                            , hierarchy = c("name"), summarizeNA = "t_statistic"
)

sumarry <- benchmark_proDA$smc$summary
prolfqua::table_facade(sumarry, caption = "nr of proteins with 0, 1, 2, 3 missing contrasts.")| nr_missing | name |
|---|---|
| 0 | 1333 |
res <- benchmark_proDA$pAUC_summaries()
knitr::kable(res$ftable$content,caption = res$ftable$caption)| contrast | what | AUC | pAUC_10 | pAUC_20 |
|---|---|---|---|---|
| all | diff | 89.88333 | 79.41932 | 84.76176 |
| all | scaled.pval | 88.76765 | 69.71608 | 76.05905 |
| all | t_statistic | 88.76765 | 69.71608 | 76.05905 |
| b_vs_a | diff | 89.88333 | 79.41932 | 84.76176 |
| b_vs_a | scaled.pval | 88.76765 | 69.71608 | 76.05905 |
| b_vs_a | t_statistic | 88.76765 | 69.71608 | 76.05905 |
res$barp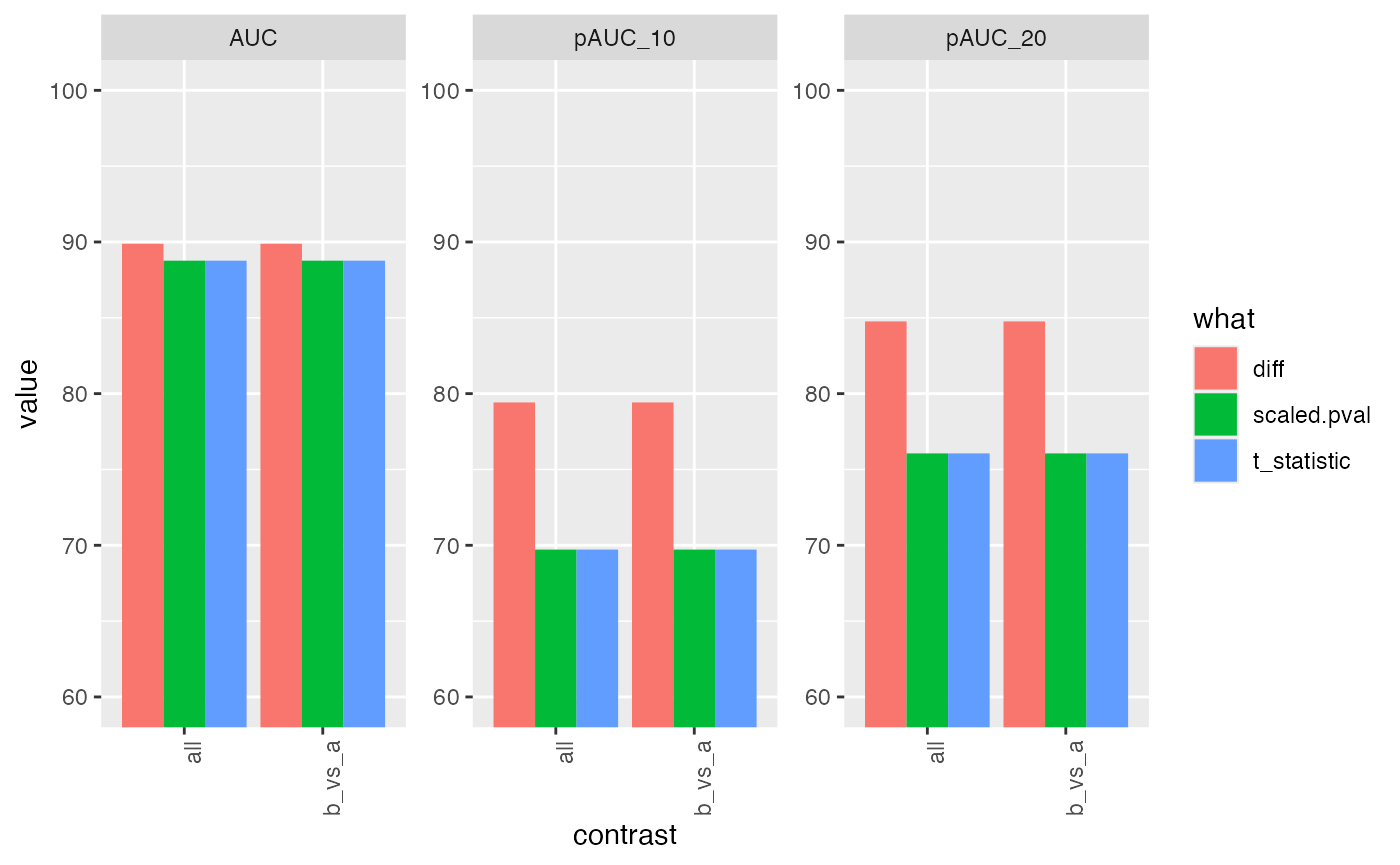
Fit model with msqrob
se <- prolfqua::LFQDataToSummarizedExperiment(lfqtransformed)

pe <- QFeatures::QFeatures(list(peptide = se), colData = colData(se))

my_medianPolish <- function(x, verbose = FALSE, ...){
  medpol <- stats::medpolish(x, na.rm = TRUE, trace.iter = verbose, maxiter = 10)
  return(medpol$overall + medpol$col)
}


pe <- QFeatures::aggregateFeatures(
  pe,
  i = "peptide", fcol = "protein_Id",
  name = "protein", fun = my_medianPolish,
)
library(msqrob2)
prlm <- msqrobHurdle(pe,
                     i = "protein",
                     formula = ~group.,
                     overwrite = TRUE)

L <- makeContrast(c("group.b=0"),
                  parameterNames = c("group.b"))
prlm <- hypothesisTestHurdle(prlm, i = "protein", L, overwrite = TRUE)

xx <- rowData(prlm[["protein"]])
hurdle <- xx[grepl("hurdle_",names(xx))]

res <- list()
for (i in names(hurdle)) {
  hurdle[[i]]$contrast <- i
  res[[i]] <- prolfqua::matrix_to_tibble(hurdle[[i]], preserve_row_names = "name")
}

hurdle <- dplyr::bind_rows(res)

logFC <- hurdle |> dplyr::select("name","contrast", starts_with("logFC"))
logFC <- filter(logFC ,!is.na(logFCt))
logFC$modelName <- "msqrobHurdleIntensity"
names(logFC) <- c("name","contrast","logFC","se","df","t","pval","modelName")

logOR <- hurdle |> dplyr::select("name","contrast", starts_with("logOR"))
logOR$modelName <- "msqrobHurdleCount"
names(logOR) <- c("name","contrast","logFC","se","df","t","pval","modelName")
ddd <- dplyr::anti_join(logOR , logFC, by = c("name", "contrast"))
all <- dplyr::bind_rows(ddd , logFC) |> dplyr::arrange(contrast, name)
all <- prolfqua::adjust_p_values(all, column = "pval", group_by_col = "contrast")
all$contrast <- "b_vs_a"


st <- lfqProt$get_Stats()
protAbundanceIngroup <- st$stats()

protAbundanceIngroup <- protAbundanceIngroup |>
  tidyr::pivot_wider(id_cols = protein_Id,
                     names_from = group., names_prefix = "abd.",
                     values_from = meanAbundance)

protAbundanceIngroup <- protAbundanceIngroup |> dplyr::mutate( avgAbd.b.a =  mean( c(abd.b,abd.a), na.rm = TRUE)  )
protAbundanceIngroup <- protAbundanceIngroup |>
  dplyr::select(-starts_with("abd")) |>
  tidyr::pivot_longer(starts_with("avgAbd"), names_to = "contrast" ,values_to = "avgAbd")

protAbundanceIngroup$contrast <- "b_vs_a"
bb <- dplyr::inner_join(all, protAbundanceIngroup, by = c("name" = "protein_Id", "contrast" = "contrast"))
ttd <- prolfquabenchmark::cptac_bench_preprocess(bb, idcol = "name")
benchmark_msqrob <- prolfqua::make_benchmark(ttd$data,
                                             contrast = "contrast",
                                             toscale = c("pval"),
                                             fcestimate = "logFC",
                                             benchmark = list(
                                               list(score = "logFC", desc = TRUE),
                                               list(score = "t", desc = TRUE),
                                               list(score = "scaled.pval", desc = TRUE)
                                             ),
                                             model_description = "msqrob2_QFeature",
                                             model_name = "msqrob2_QFeature",
                                             FDRvsFDP = list(list(score = "pval.adjusted", desc = FALSE))
                                             , hierarchy = c("name"), summarizeNA = "t"
)

sum(benchmark_msqrob$smc$summary$name)
## [1] 1333
sumarry <- benchmark_msqrob$smc$summary
prolfqua::table_facade(sumarry, caption = "nr of proteins with 0, 1, 2, 3 missing contrasts.")| nr_missing | name |
|---|---|
| 0 | 1333 |
res <- benchmark_msqrob$pAUC_summaries()
knitr::kable(res$ftable$content,caption = res$ftable$caption)| contrast | what | AUC | pAUC_10 | pAUC_20 |
|---|---|---|---|---|
| all | logFC | 91.21045 | 72.41562 | 82.47754 |
| all | scaled.pval | 89.14710 | 68.86657 | 75.71925 |
| all | t | 88.82240 | 66.07264 | 74.19014 |
| b_vs_a | logFC | 91.21045 | 72.41562 | 82.47754 |
| b_vs_a | scaled.pval | 89.14710 | 68.86657 | 75.71925 |
| b_vs_a | t | 88.82240 | 66.07264 | 74.19014 |
res$barp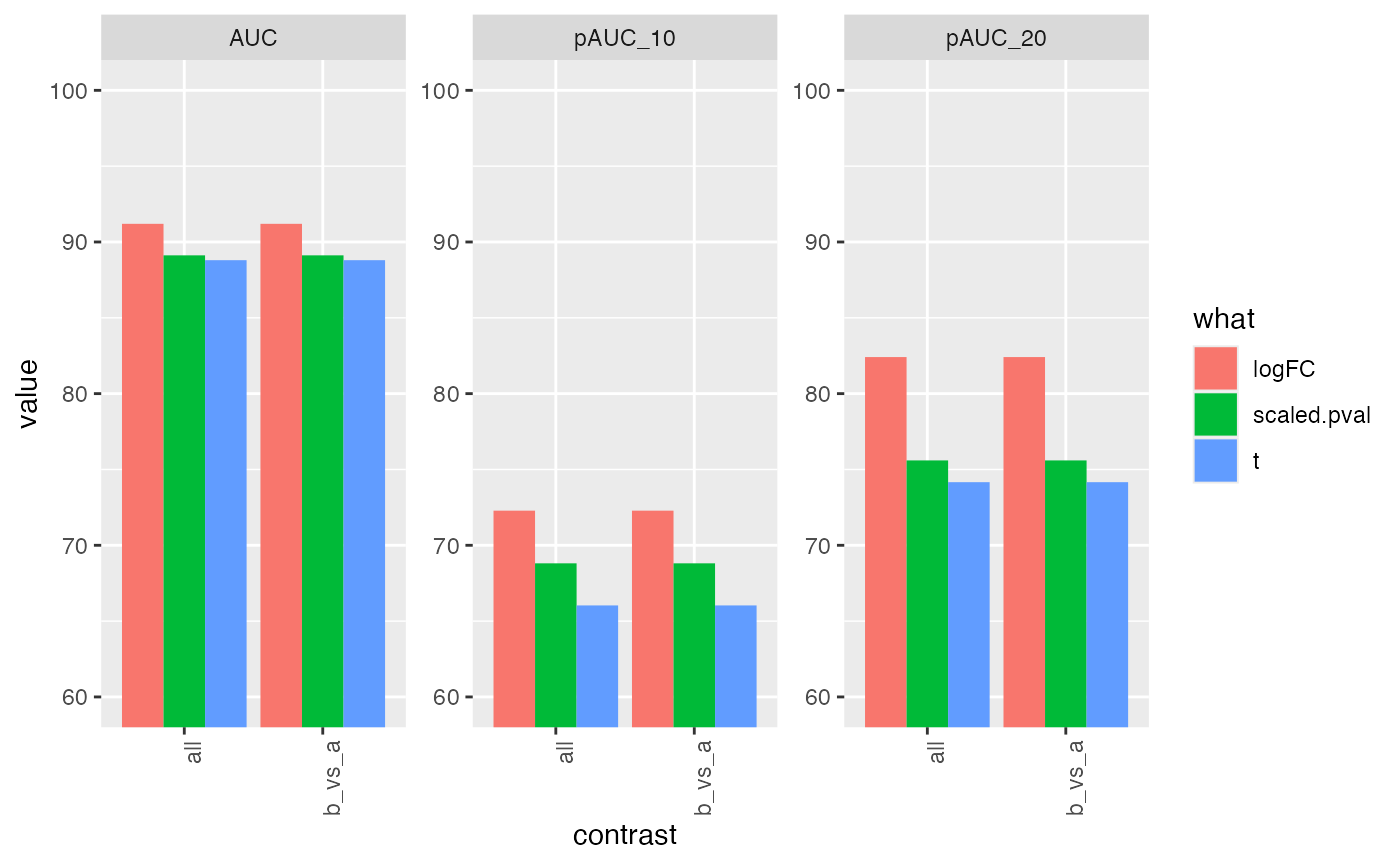
Compare benchmark results.
bdir <- file.path("../inst/Benchresults/",format( Sys.Date(), "%Y%m%d"))
if (!dir.exists(bdir)) {dir.create(bdir)}

saveRDS(list(benchmark_msqrob = benchmark_msqrob,
             benchmark_proDA = benchmark_proDA,
             benchmark_merged = benchmark_merged),
        file = file.path("../inst/Benchresults/",format( Sys.Date(), "%Y%m%d"),"CPTAC_Benchmark.RDS"))

mrob <- benchmark_msqrob$pAUC_summaries()$ftable$content
mrob$package <- "msqrob2"
proda <- benchmark_proDA$pAUC_summaries()$ftable$content
proda$package <- "proDA"
prolfqua <- benchmark_merged$pAUC_summaries()$ftable$content
prolfqua$package <- "prolfqua"

all <- dplyr::bind_rows(list(mrob, proda, prolfqua))
all <- all |> filter(contrast == "b_vs_a")
all$what[all$what == "statistic"] <- "t_statistic"
all$what[all$what == "t"] <- "t_statistic"
all$what[all$what == "scaled.pval"] <- "scaled.p.value"
all$what[all$what == "logFC"] <- "diff"

all |> ggplot(aes(x = what, y = pAUC_10, group = package, color = NULL, fill = package)) +
geom_bar(stat = "identity", position = position_dodge()) 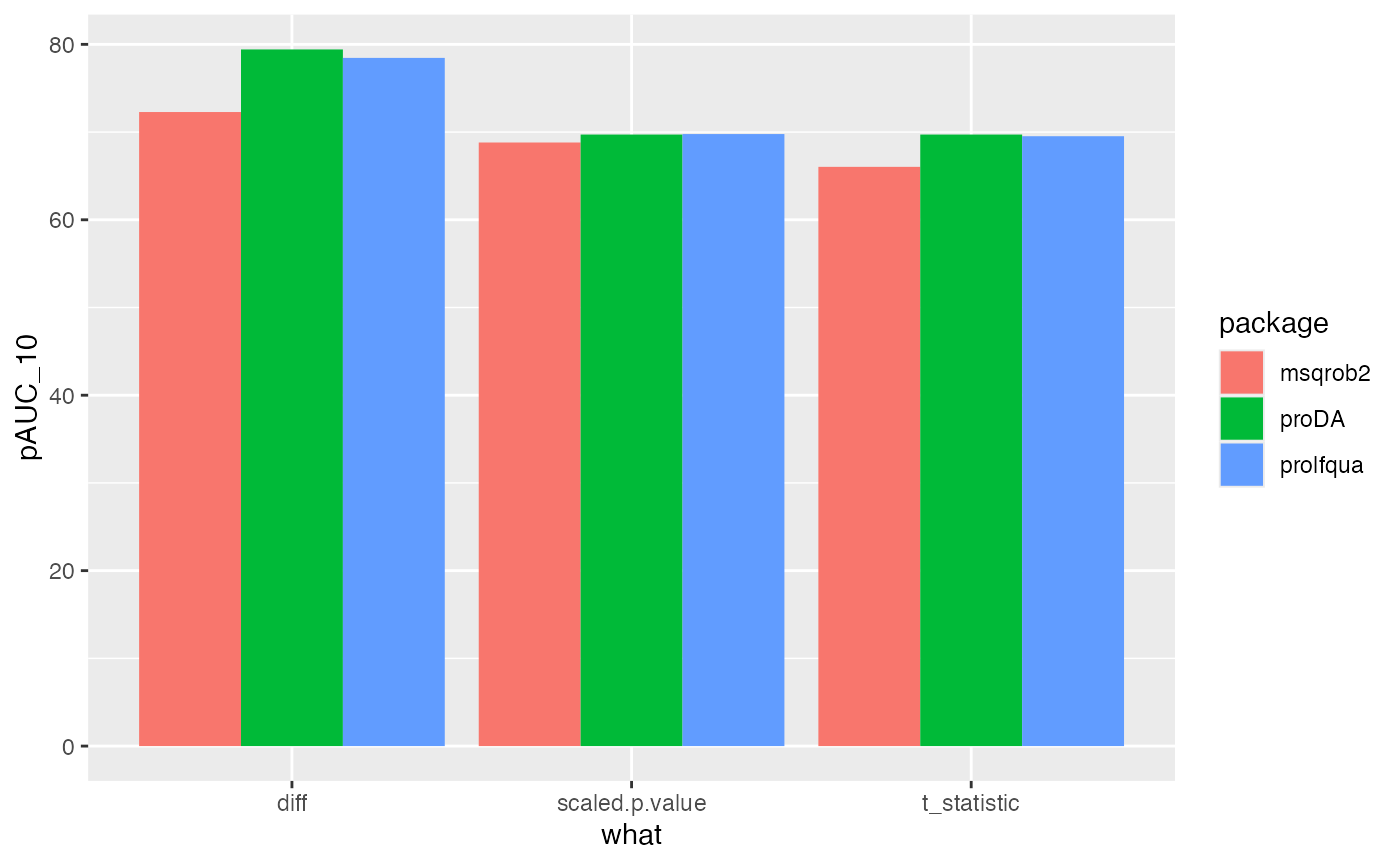
Comparing msqrob2, proda and prolfqua using the pAUC_{10}
ttmsqrob <- benchmark_msqrob$data()
ddmsqrob <- pROC::roc(ttmsqrob$TP, ttmsqrob$scaled.pval, partial.auc = c(1, 0.9))

ttprolfqua <- benchmark_merged$data()
ddprolfqua <- pROC::roc(ttprolfqua$TP, ttprolfqua$scaled.p.value, partial.auc = c(1, 0.9))

ttproda <- benchmark_proDA$data()
ddproda <- pROC::roc(ttproda$TP, ttproda$scaled.pval, partial.auc = c(1, 0.9))


tmp <- c(msqrob2_vs_prolfqua = pROC::roc.test(ddmsqrob,ddprolfqua, progress = "none")$p.value,
         msqrob2_vs_proda = pROC::roc.test(ddmsqrob,ddproda, progress = "none")$p.value,
         prolfqua_vs_proda = pROC::roc.test(ddprolfqua,ddproda, progress = "none")$p.value)
We observe that for this benchmark data, there are no significant differences among the for the three packages. The Table @ref(tab:shwoROCtestREsults) shows the results of the Bootstrap test for two ROC curves.
knitr::kable(data.frame(pROC_test = names(tmp), p.value = tmp), caption = "p-values for pairwise comparsions of partial AUC")| pROC_test | p.value | |
|---|---|---|
| msqrob2_vs_prolfqua | msqrob2_vs_prolfqua | 0.9188420 |
| msqrob2_vs_proda | msqrob2_vs_proda | 0.9211654 |
| prolfqua_vs_proda | prolfqua_vs_proda | 0.9960733 |